Ultrafiltration + RO plant design example
A worked engineering example showing how EngiMetric models ultrafiltration as a quantitative pretreatment barrier ahead of reverse osmosis — its filtrate recovery, the mass balance it produces, how that filtrate becomes the RO feed, and the engineering requirements derived from the result.
Synthetic demonstration / educational example — not project design. This is an illustrative case that exercises the workflow. It is not a real plant, not a client project and not a procurement-ready design.
What this example demonstrates
Demonstrated quantitatively
- UF as a real process stage in the treatment train.
- UF filtrate recovery of 95%.
- The UF feed, filtrate and loss split.
- Stage-to-stage flow continuity into the RO feed.
- A five-stage mass balance that closes.
- The RO salt balance, with concentrate TDS derived by conservation.
- Derived engineering requirements, and the ones that stay missing.
The limit worth stating plainly
UF is modelled here as a pretreatment barrier. It does not perform the desalination duty. The 116.4 m³/day leaving the UF stage is removed solids, not salt. The entire dissolved salt load passes through UF untouched and is removed downstream by the RO stage — which is why the RO feed TDS is unchanged at 35000 mg/L.
Reading UF as a desalination step would misread this plant entirely. Its value is that it hands the RO stage a defined, low-solids feed.
Design basis
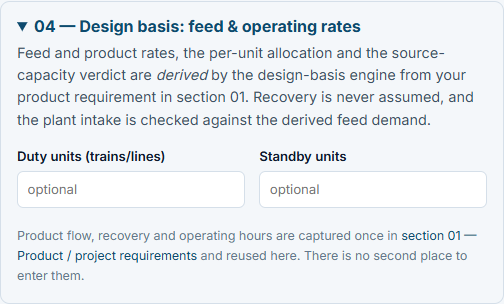
These are the values the engineer stated. Everything the model derives from them appears in the next section, deliberately kept apart.
Stated requirements and feedwater
Process basis
Membrane flux, area and recovery are an engineer or supplier basis chosen so the case is internally consistent and runnable. They are not a catalogue entry and not a recommendation.
The treatment train
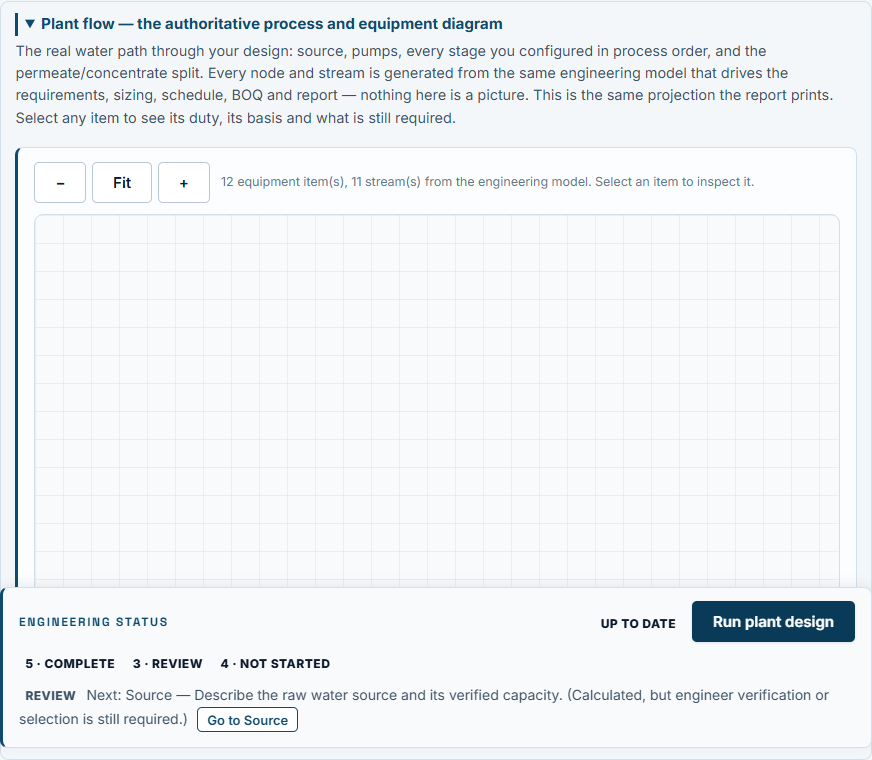
Five stages. Each one changes the flow basis the next one is designed against — which is the whole argument of this page.
- Multimedia filter
Granular-bed solids removal ahead of the membranes.
- Antiscalant dosing
Chemical dosing step. Carries no flow loss of its own.
- Ultrafiltration The subject of this example
The barrier this example exists to demonstrate.
- Reverse osmosis
Desalination. The only stage that removes dissolved salt.
- Remineralisation
Post-treatment stability. No flow change.
Mass balance across the train
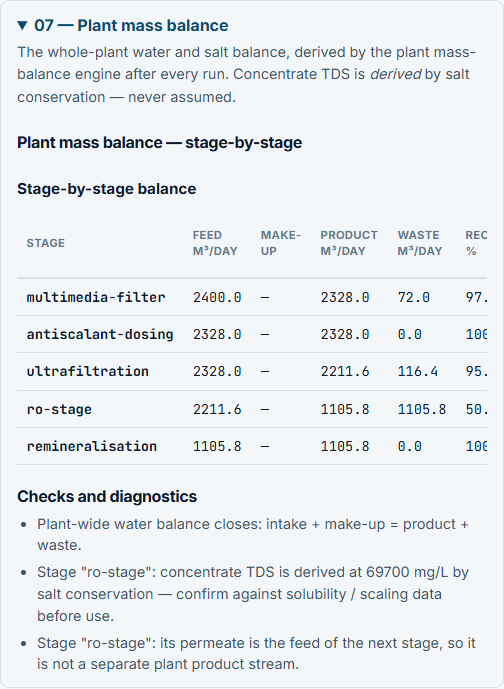
Model-derived stage balance. These are the values the running engineering model produced for this case — not hand-calculated assumptions and not a second calculation performed on this page.
| Stage | Feed | Product | Loss | Recovery |
|---|---|---|---|---|
| Multimedia filter | 2400.0 | 2328.0 | 72.0 | 97.0% |
| Antiscalant dosing | 2328.0 | 2328.0 | 0.0 | 100.0% |
| Ultrafiltration | 2328.0 | 2211.6 | 116.4 | 95.0% |
| Reverse osmosis | 2211.6 | 1105.8 | 1105.8 | 50.0% |
| Remineralisation | 1105.8 | 1105.8 | 0.0 | 100.0% |
Flows in m³/day. Every stage product equals its feed multiplied by the recovery stated in the design basis, and every row closes.
The UF stage, in full
Feed 2328.0 × 95% recovery = 2211.6 m³/day filtrate
2328.0 − 2211.6 = 116.4 m³/day removed as UF concentrate
That 116.4 m³/day is the number that matters downstream. It is not lost from the plant — it leaves UF as a solids-laden concentrate stream, and the RO stage is designed for what remains.
UF feeds RO directly
The UF filtrate is the downstream RO feed, in the same engineering model — not a figure copied onto this page. That continuity is what separates UF as part of the modelled treatment train from UF as a decorative box in a diagram. If the two figures ever disagreed, the balance would not close; they are the same number.
Where the salt goes
UF removes solids, not salt, so the RO stage receives the full feed salinity. All desalination happens here.
Concentrate quality is derived by salt conservation, not specified. The salt entering the RO stage has to leave somewhere, so concentrate TDS is fixed by feed salinity, recovery and rejection. It cannot be chosen independently — which is why it is a result rather than an input. Displayed values are rounded to the precision the application displays.
Engineering requirements
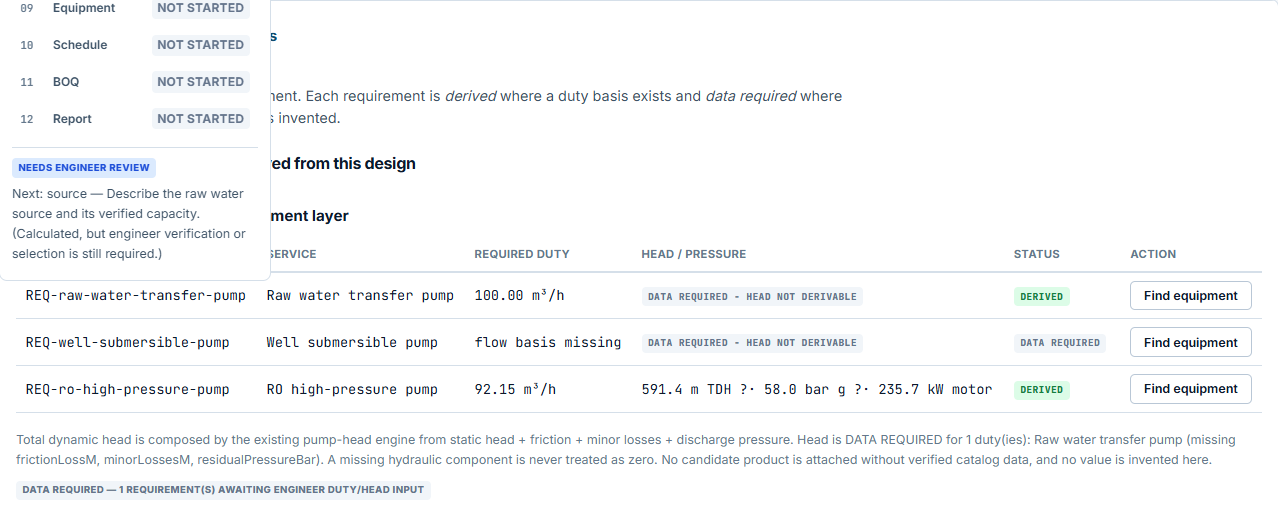
One requirement per duty, each labelled with its basis. The distinction below is the important one: a professional workflow reports what it cannot derive instead of inventing it.
| Requirement | Derived value | State |
|---|---|---|
| Raw water transfer pump | 100.00 m³/h | DERIVED DATA REQUIRED - head not derivable |
| Well submersible pump | flow basis missing | DATA REQUIRED DATA REQUIRED - head not derivable |
| RO high-pressure pump | 92.15 m³/h | DERIVED 591.4 m TDH ?· 58.0 bar g ?· 235.7 kW motor |
The well submersible pump has no flow basis and no head in this case, and it is reported as data required — not zero-filled, not estimated. A blank in a professional tool is information.
Outputs, and what is deliberately still empty
- Engineering model complete
- Mass balance complete
- Engineering requirements 3 rows
- Equipment awaiting selection
- Schedule awaiting equipment
- Bill of quantities awaiting equipment
- Engineering report awaiting equipment
Why the last four are empty
Equipment selection matches products against each requirement using the verified manufacturer catalog, and it is an engineer decision. Until it is made, the application reports those stages as not started and the report states plainly that no equipment has been selected by the engineer. That is the workflow behaving correctly, not a gap: it will not present an equipment list it did not derive.

What EngiMetric models here
Quantitatively modelled in this case
- Media filtration filtrate recovery and its loss.
- UF filtrate recovery and its solids-removal split.
- RO stage recovery, permeate and concentrate flows.
- RO salt balance, with concentrate TDS by conservation.
- Stage-to-stage stream continuity.
- Engineering requirement derivation where a duty basis exists.
Not quantified here
- Membrane fouling prediction — not modelled.
- Per-element array staging and concentration-polarisation profiling — not modelled.
- Second-pass or interstage quantitative transfer — not modelled.
- Equipment vendor selection, and the equipment-dependent outputs it gates — requires engineer action.
Why this relationship matters
Pretreatment is not a list of boxes in a treatment train. In a real design each barrier changes the flow basis the next one is sized against, and ignoring that is how a design ends up unbuildable.
This example shows the relationship numerically. UF receives 2328.0 m³/day and produces 2211.6 m³/day of filtrate. The RO stage is then sized against 2211.6 m³/day — not the raw intake. EngiMetric carries that relationship through the train rather than treating UF as a decorative process node, which is why the balance closes and the diagram cannot disagree with the model.
Evidence
Every figure on this page was read from a capture of the running application, recorded on 6 October 2026 with zero console errors. The capture log stores the case id, the reload URL, each action and the observed output.
Now design your own
This case is one train out of many. Open the Designer with it loaded, change the source, the recovery or the feedwater chemistry, and watch the balance, the requirements and the diagram move together — because they are all derived from one engineering model.
Design this as a plant Explore UF calculators
RO worked example Membrane technologies Pretreatment knowledge All demo cases
Check this example yourself
- Ultrafiltration (UF) Membrane Engineering
Size UF membrane area from permeate flow and design flux, compute transmembrane pressure from the feed/filtrate/concentrate pressures, and read normalised flux against the reference condition to expose fouling.
- Nanofiltration (NF) Membrane Engineering
Close the NF water and solute balance from a stated recovery and rejection to get permeate and concentrate flow and TDS, then size membrane area from the permeate flux.
- Filter Sizing Calculator
Size a conventional rapid-gravity multimedia filter from design flow, filtration rate, bed depth and media effective size: required filter area, design area after the engineer's safety factor, and media volume. The unit count needs a stated catalogue unit area, and no clean-water head loss is invented.
- Cartridge Filter Sizing Calculator
Size cartridge and bag filter elements and housings from design flow, feed solids and the manufacturer's element flow rating: hourly solids load, element count and housing count. No element size is assumed and no differential pressure is invented.