Desalination Plant Design Guide
This guide takes you from an empty designer to a complete, checked preliminary seawater reverse-osmosis design. It follows the real twelve-stage workflow of the Plant Designer, and it works through one case end to end: Single-Stage RO.
Every figure in this guide is a screenshot of the running application. Every number is read out of a real run. Nothing is drawn by hand.
Open the Plant Designer Download the worked example’s report (PDF)
1. How to read this guide
The designer labels every value it shows. Getting comfortable with those labels is the difference between a design you can defend and one you cannot, so they come first.
- INPUT
- Something you typed. It is your responsibility and your document reference.
- DERIVED
- Computed by the engineering model from your inputs. Traceable, but still not verified by an engineer.
- MANUFACTURER DATA
- Verified external technical information taken from a published source.
- MISSING / DATA REQUIRED
- Not supplied. A blank field is never quietly treated as zero, and the checks it feeds simply do not run.
- PRELIMINARY
- Calculated on a stated basis, but not verified. Safe to design around; not safe to build from.
- COMMERCIAL DATA
- A price that you recorded. EngiMetric never invents a price.
- ENGINEER VERIFICATION REQUIRED
- A decision the software deliberately refuses to make on your behalf.
Two rules follow from this and they hold everywhere in the tool: a stage is not complete merely because you opened it, and changing an upstream input flags the affected downstream stages needs recalculation instead of letting them look finished.
2. The twelve-stage workflow
The designer is organised as twelve numbered stages. The status bar at the top of the page always shows a real state for each one, so you can see what is done and what still needs you. These are the states observed on the worked example after one run:
- 01 Product requirements Complete
- 02 Source Needs engineer review
- 03 Feedwater analysis Needs engineer review
- 04 Design basis Complete
- 05 Treatment selection Needs engineer review
- 06 Treatment train Complete
- 07 Plant mass balance Complete
- 08 Engineering requirements Complete
- 09 Equipment selection Not started
- 10 Equipment schedule Not started
- 11 Bill of quantities Not started
- 12 Engineering report Not started
The pattern is worth noticing. The stages that depend on measured source data — 02 Source and 03 Feedwater analysis — sit at needs engineer review even on a fully-run design, because nothing in the software can confirm a wellfield or a laboratory analysis. Stages 09 to 12 stay not started until equipment is selected, which is your decision to make.
3. Start with the product requirement
The first real engineering question is not how much water we need. It is the product requirement: required product flow, target product TDS, plant recovery target, operating hours, availability and the end use.
From product flow and recovery, EngiMetric derives the raw plant intake as product divided by recovery. You are not asked to invent an intake figure, and if it cannot be derived it is reported as data required rather than guessed.
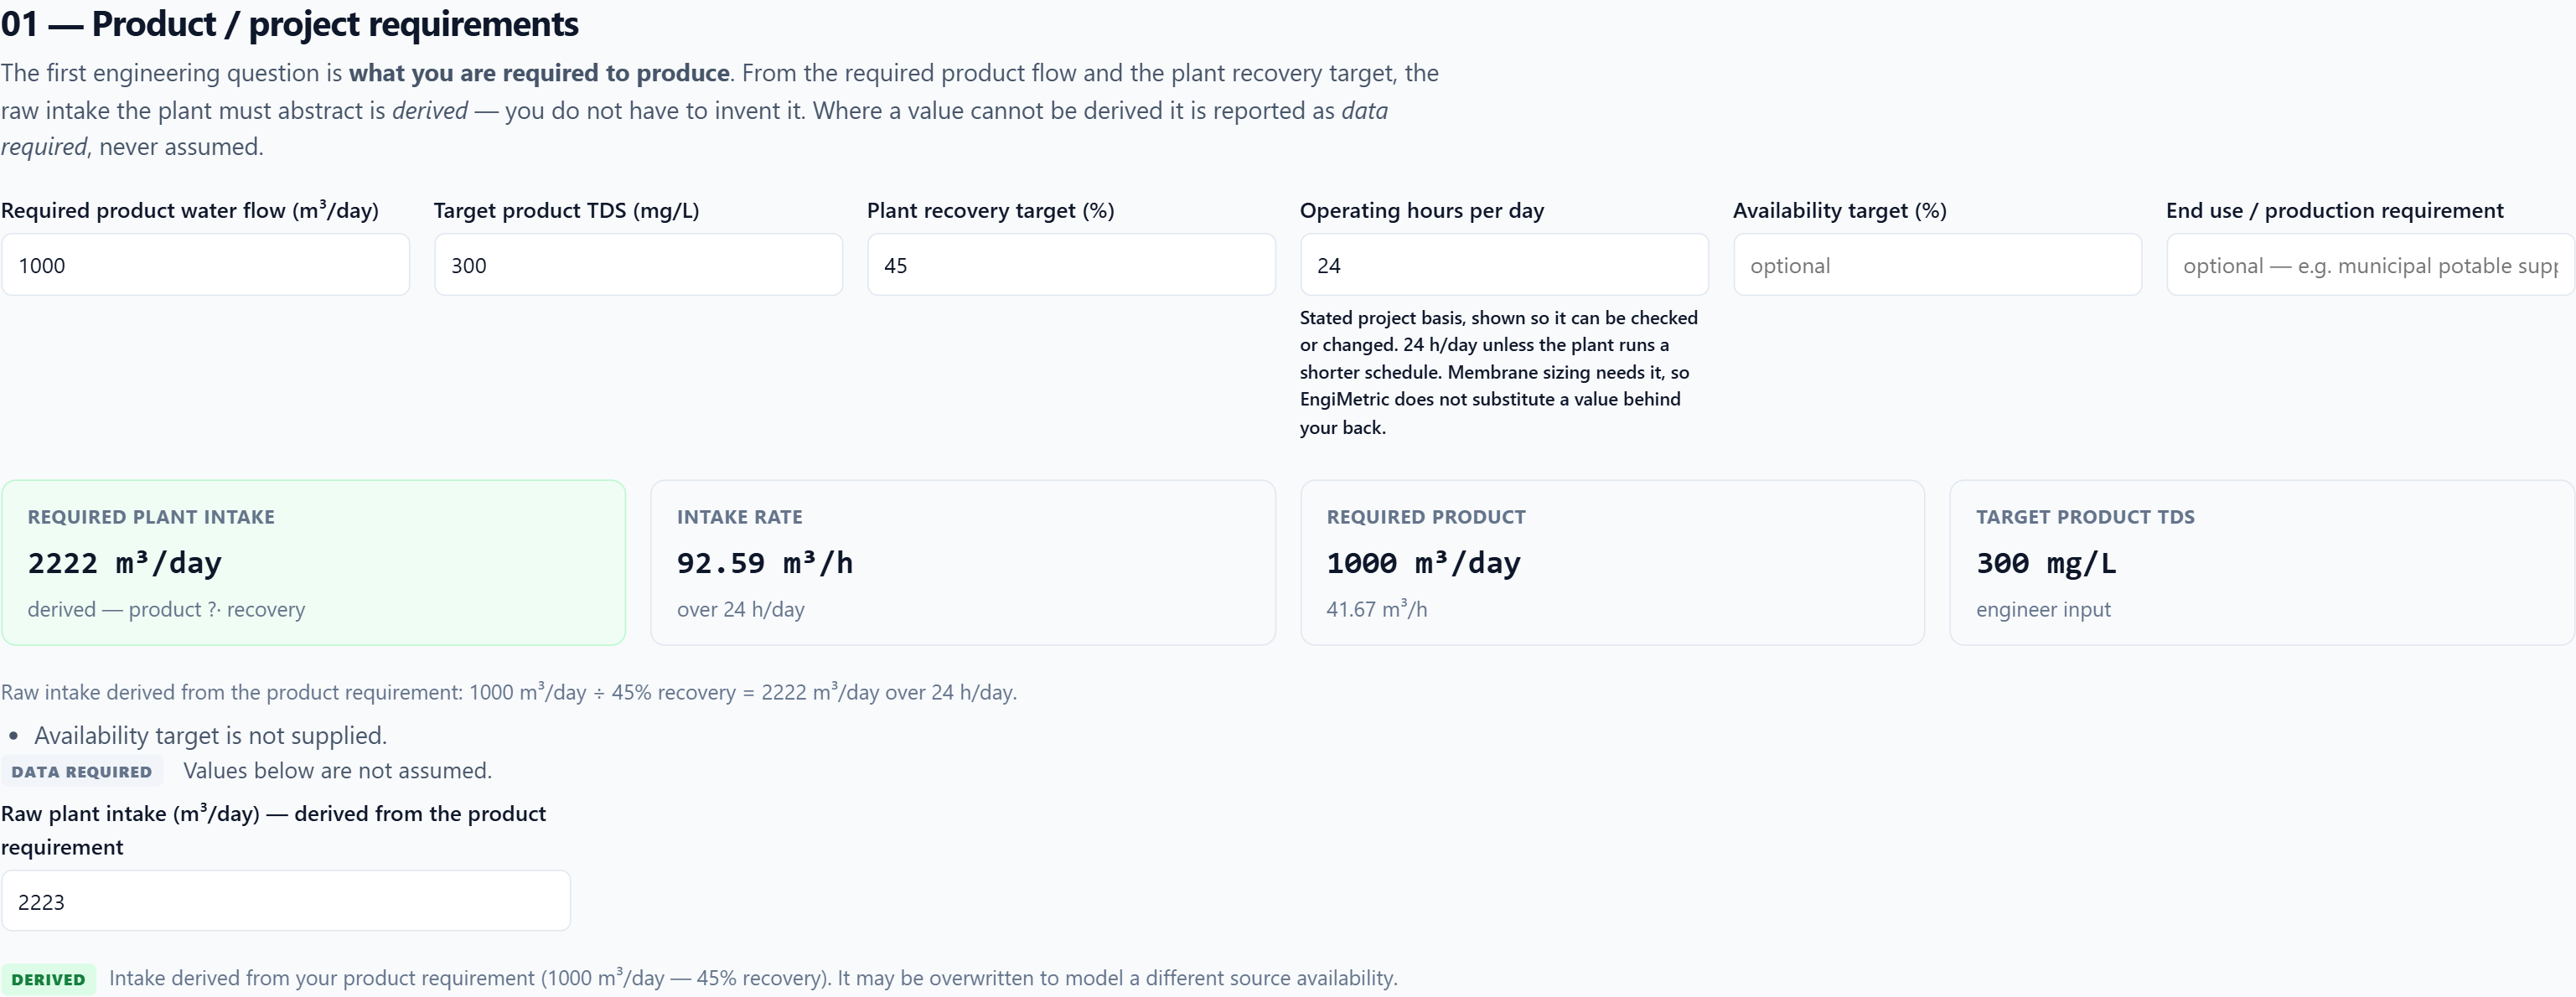
Notice what the panel does with the answer. It does not merely report the derived number, it checks it against your requirement and tells you the margin, so a design that only just meets its target is visible before you get any further.
4. Model the source honestly
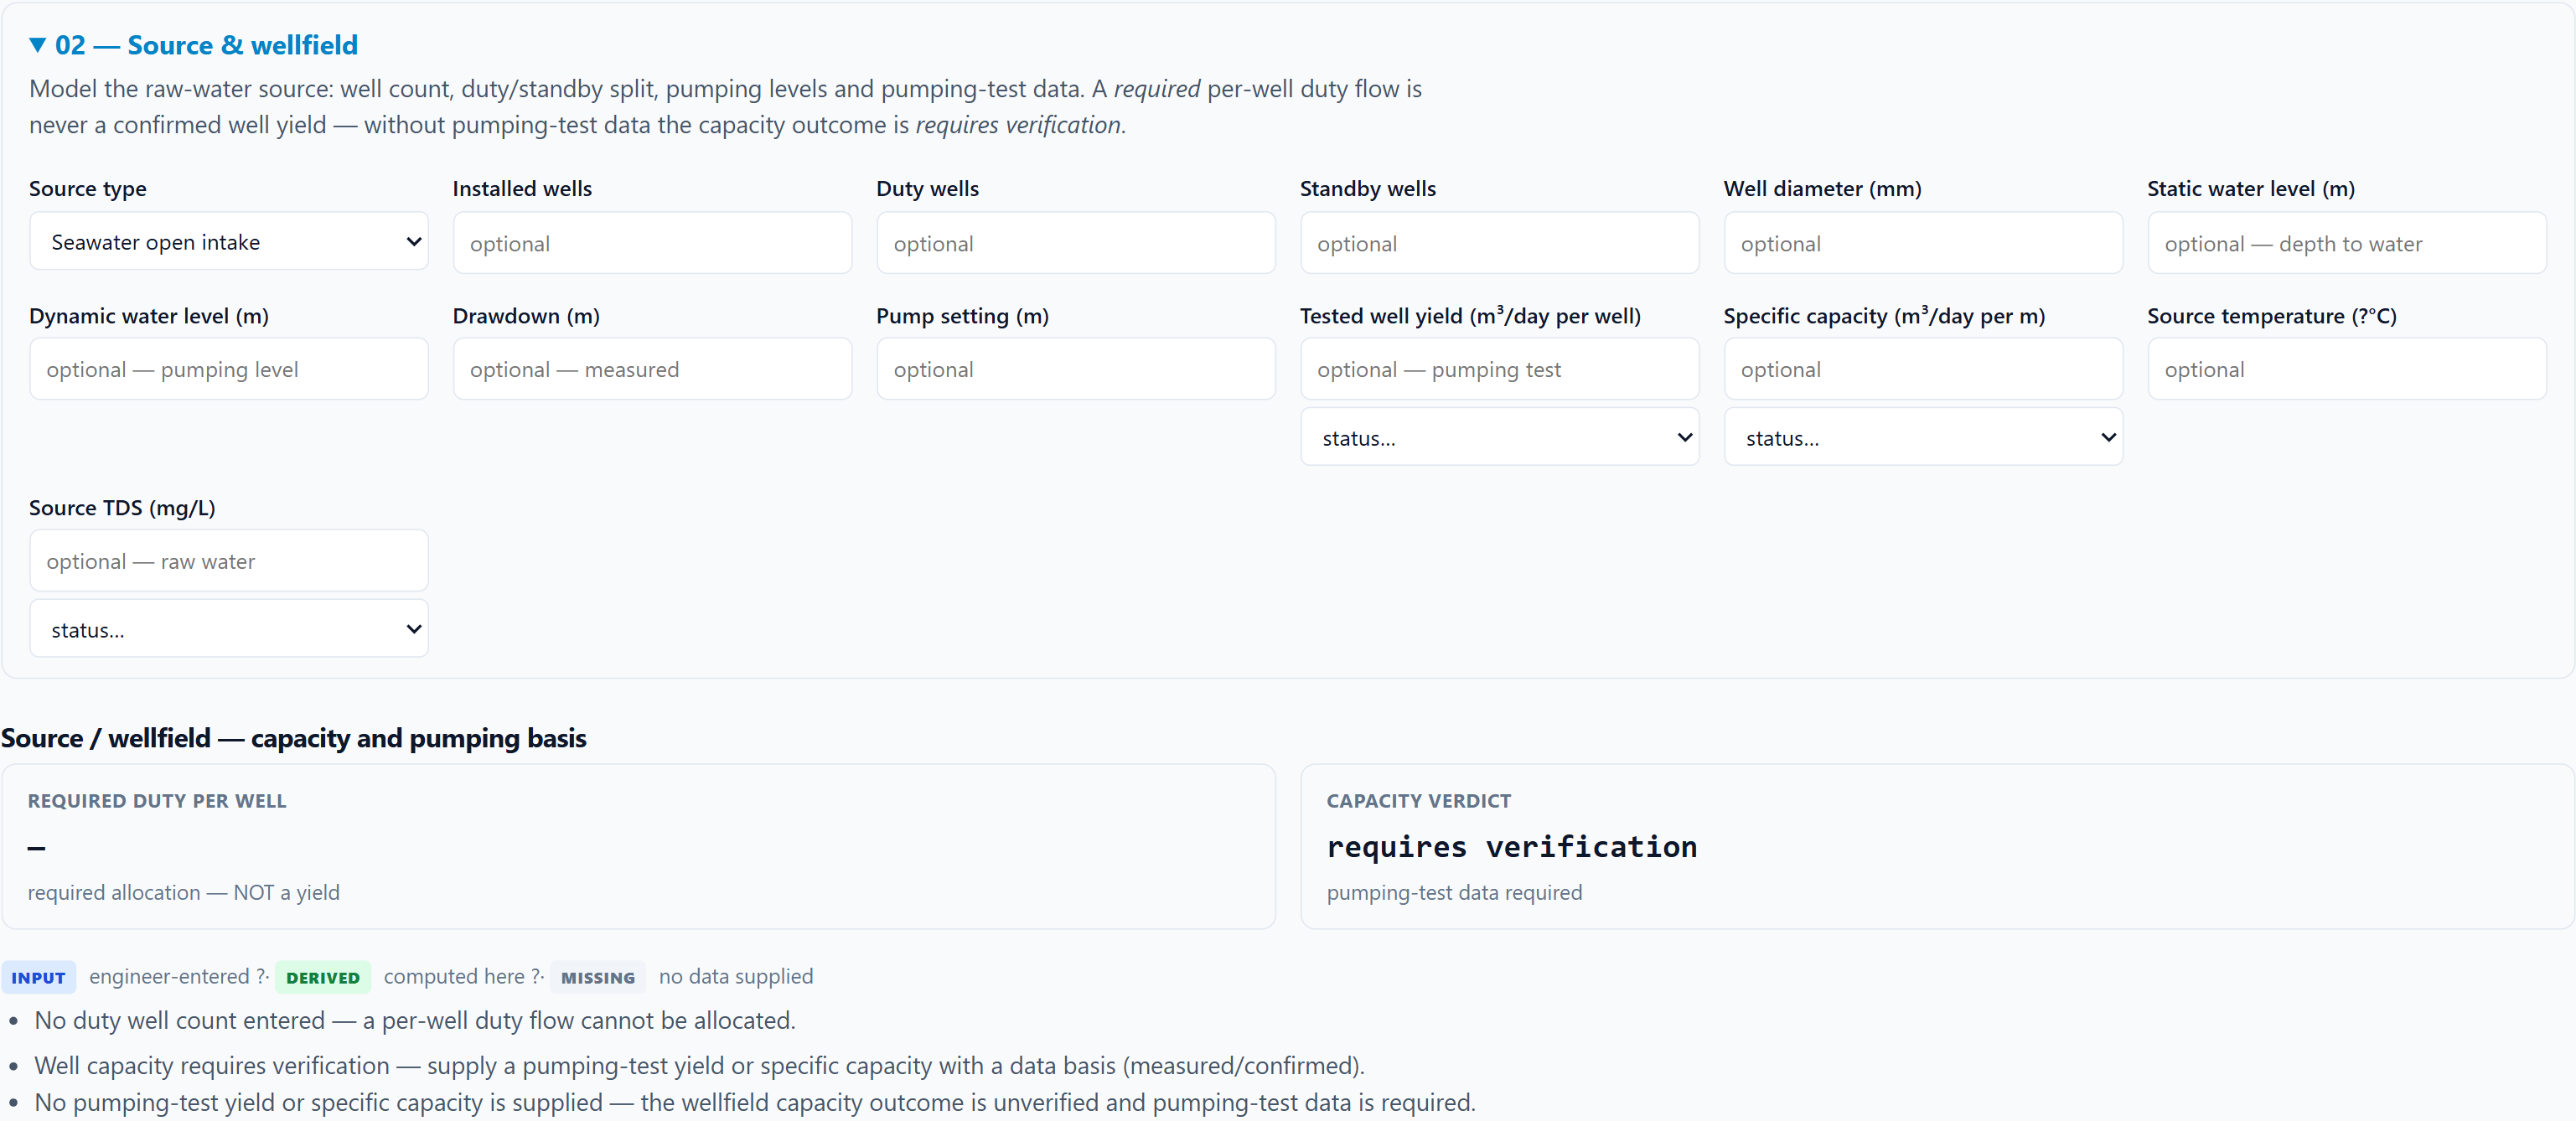
The source stage captures what is actually known about the raw water: source type, installed and duty wells, well diameter, static and dynamic levels, drawdown, tested well yield and specific capacity, source temperature and TDS.
The distinction that matters most here: a required per-well duty flow is an allocation from plant demand, not a confirmed well yield. The tool never presents the number it needs as though it were a measurement. Where measured pumping-test data is absent, the capacity verdict stays requires verification.
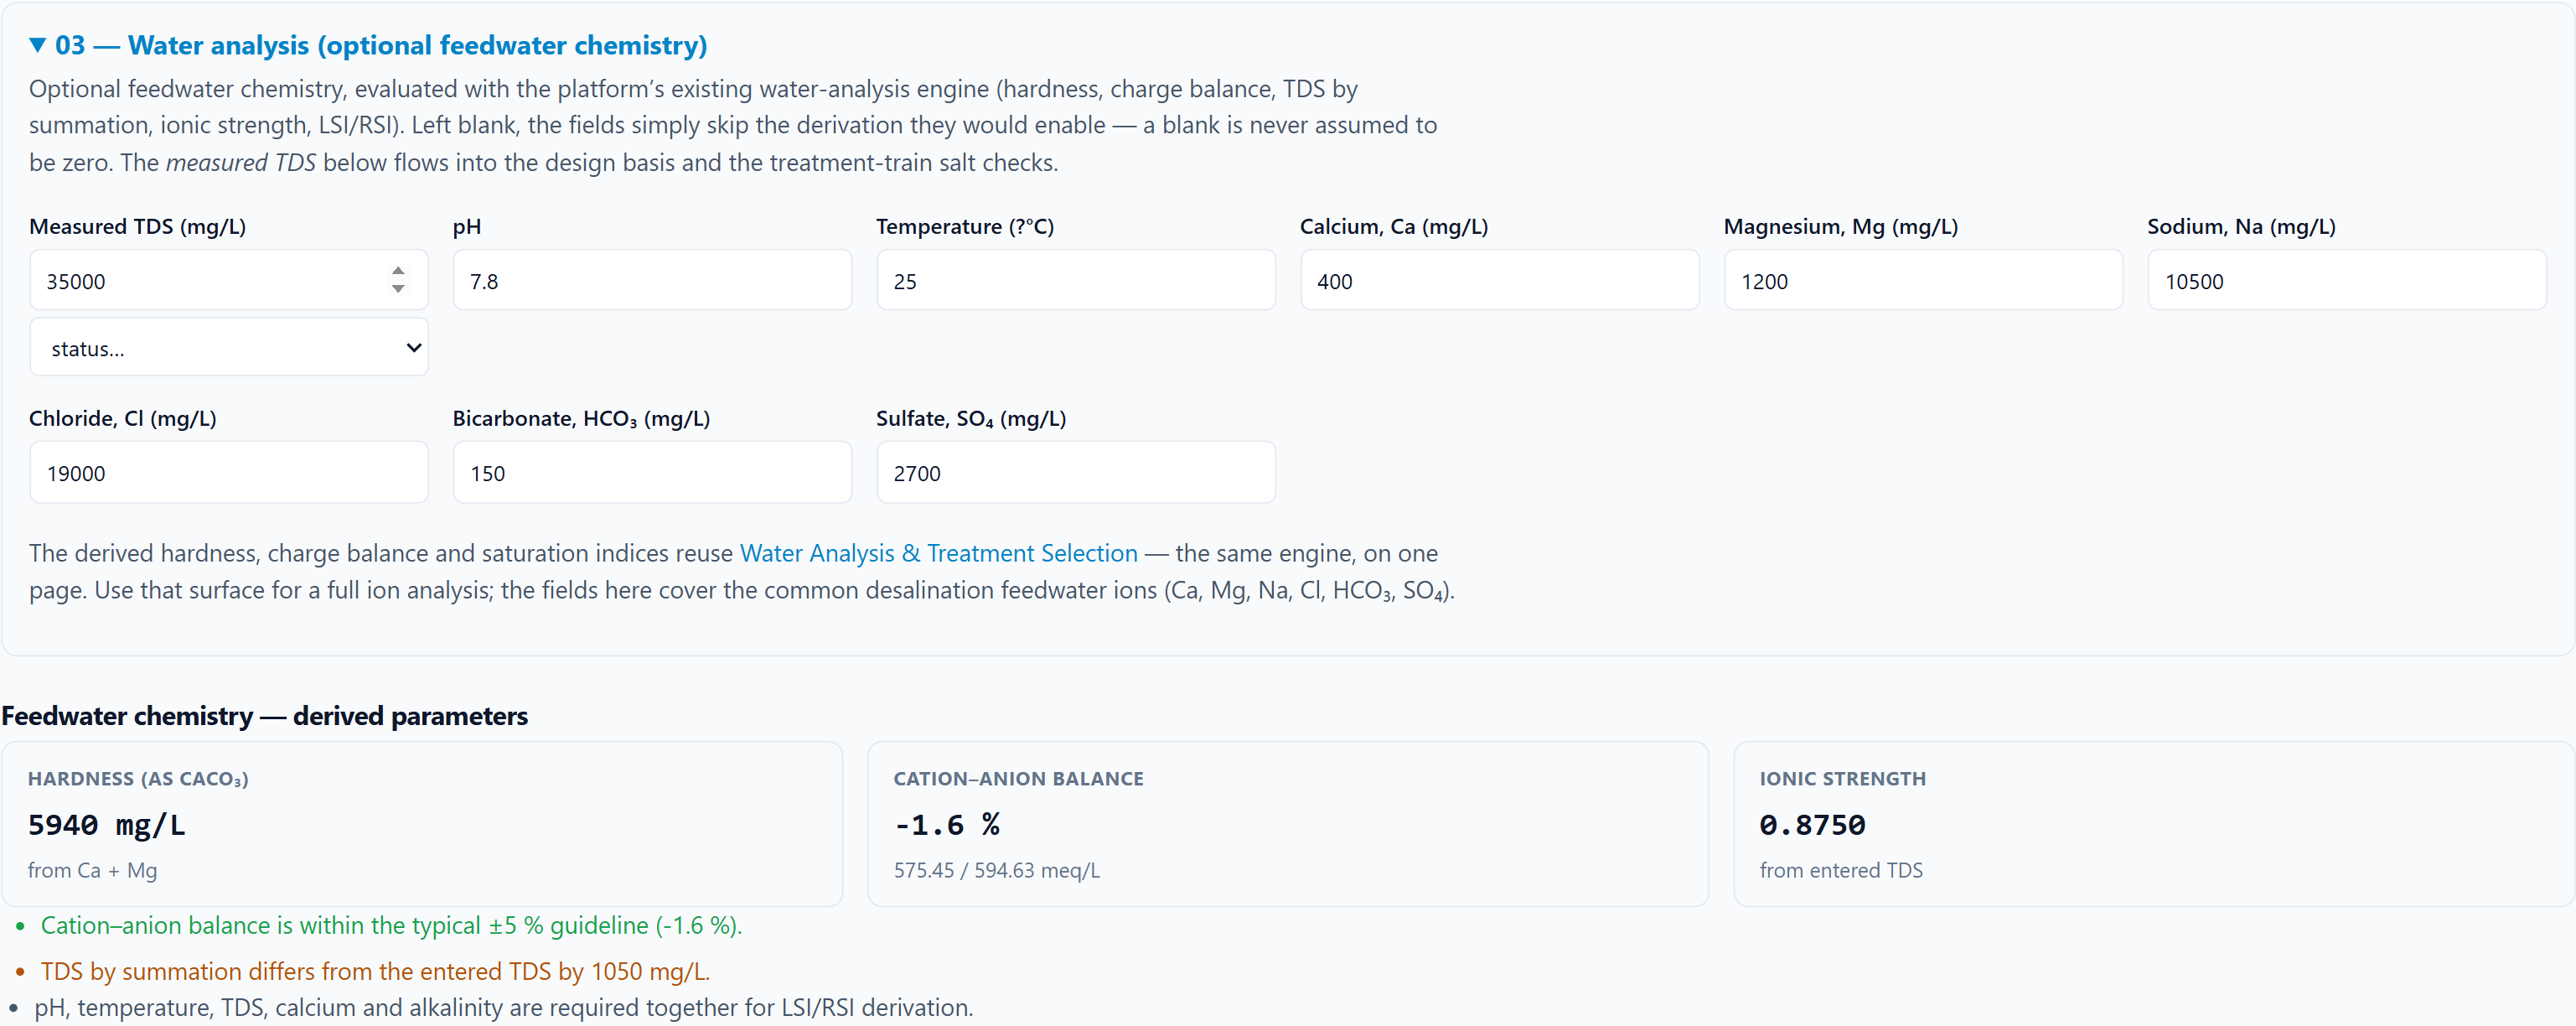
Feedwater analysis sits alongside it. Enter the ions you actually have with pH, temperature and measured TDS, and the platform derives hardness, the cation-anion balance and the LSI/RSI saturation tendency. A blank field is skipped, never assumed to be zero.
5. Build the treatment train
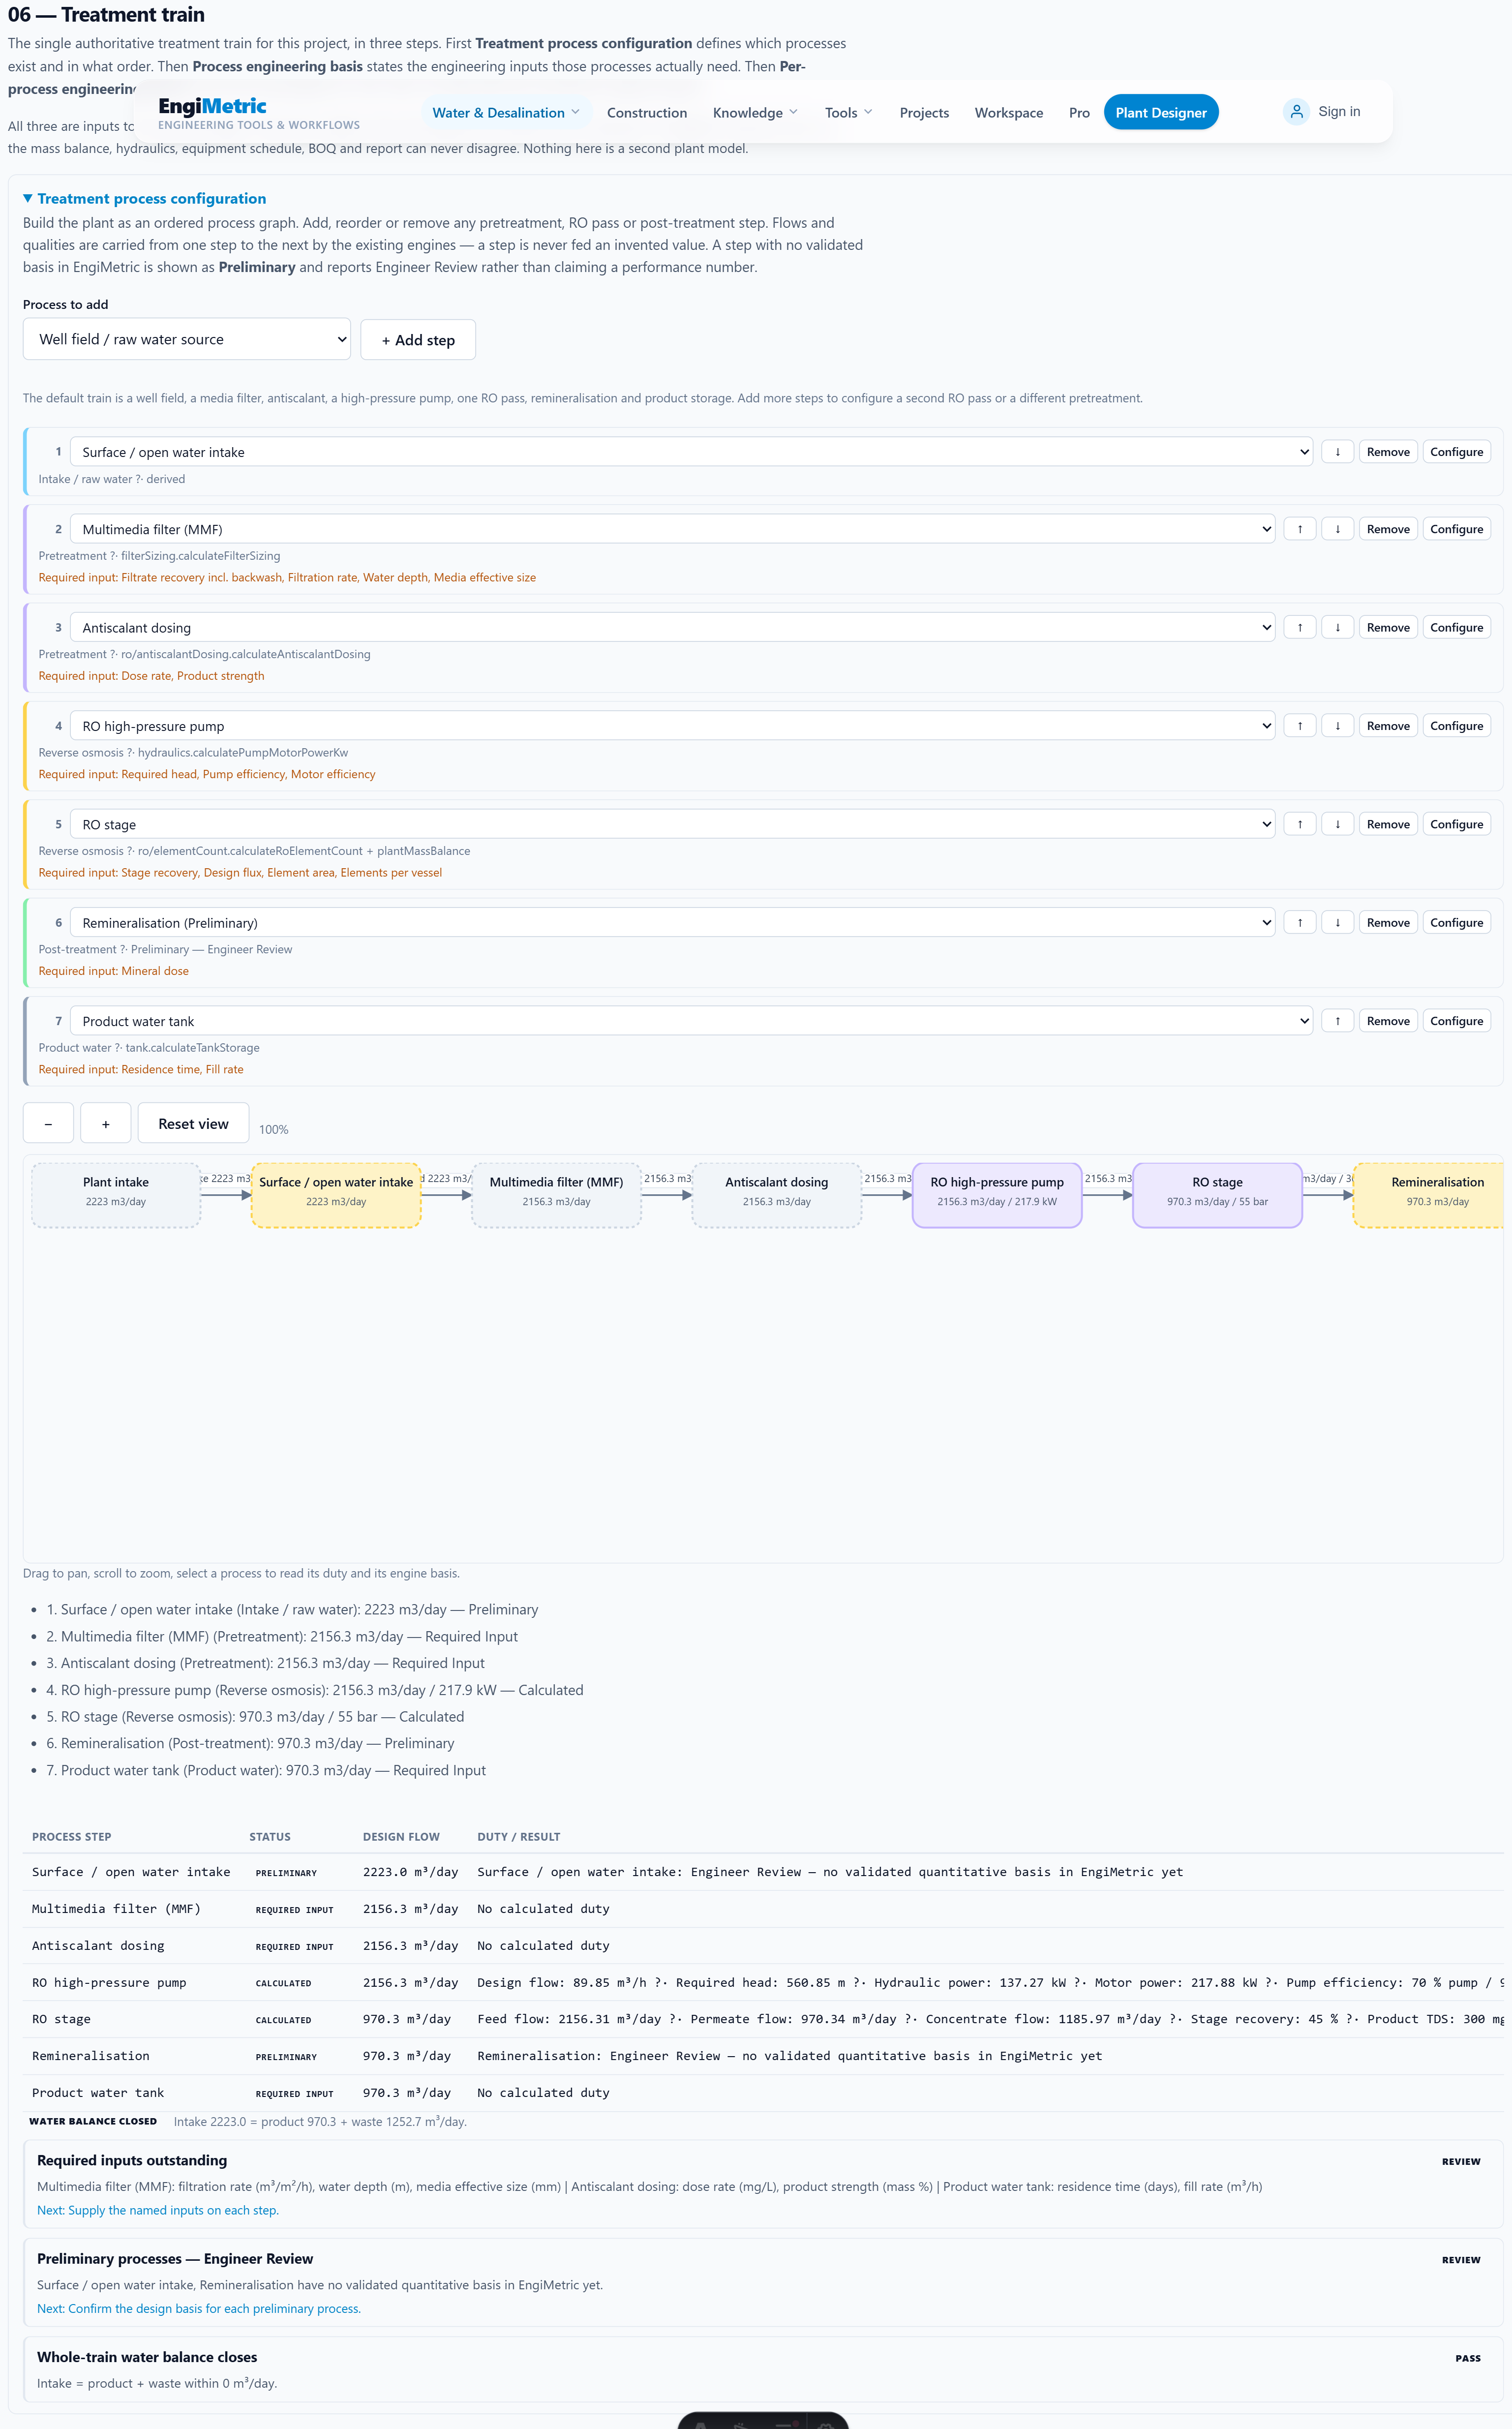
The heart of the tool is the treatment train: one ordered chain of unit operations, added in process order, from raw intake through to product and waste. Use Add step and pick a process; the designer places it in a legal slot for you rather than blindly appending, so a pretreatment barrier cannot land after the dosing skid it is meant to protect.
Each step carries its own inputs and its own basis. A multimedia filter states its net filtrate recovery; an RO stage states its recovery, design flux, element area, elements per vessel and feed pressure. Blank optional fields are reported as missing and only disable the checks they feed — the plant water balance still runs.
Why the diagram is trustworthy
The interactive diagram and the diagram in the printed report are two renderings of one projection. Both are built from the configured train, so a step cannot appear in one and be missing from the other, and the node order in the picture is the order of the stages you configured.
6. Watch the train grow
The clearest way to understand the train is to build one. The five figures below were captured from a real session: the designer was emptied, then rebuilt one group of processes at a time using the ordinary Add step and Remove controls.
Each figure shows the whole configured chain at that moment. The intake terminal is always present, because a plant must have a source before it can have a process.
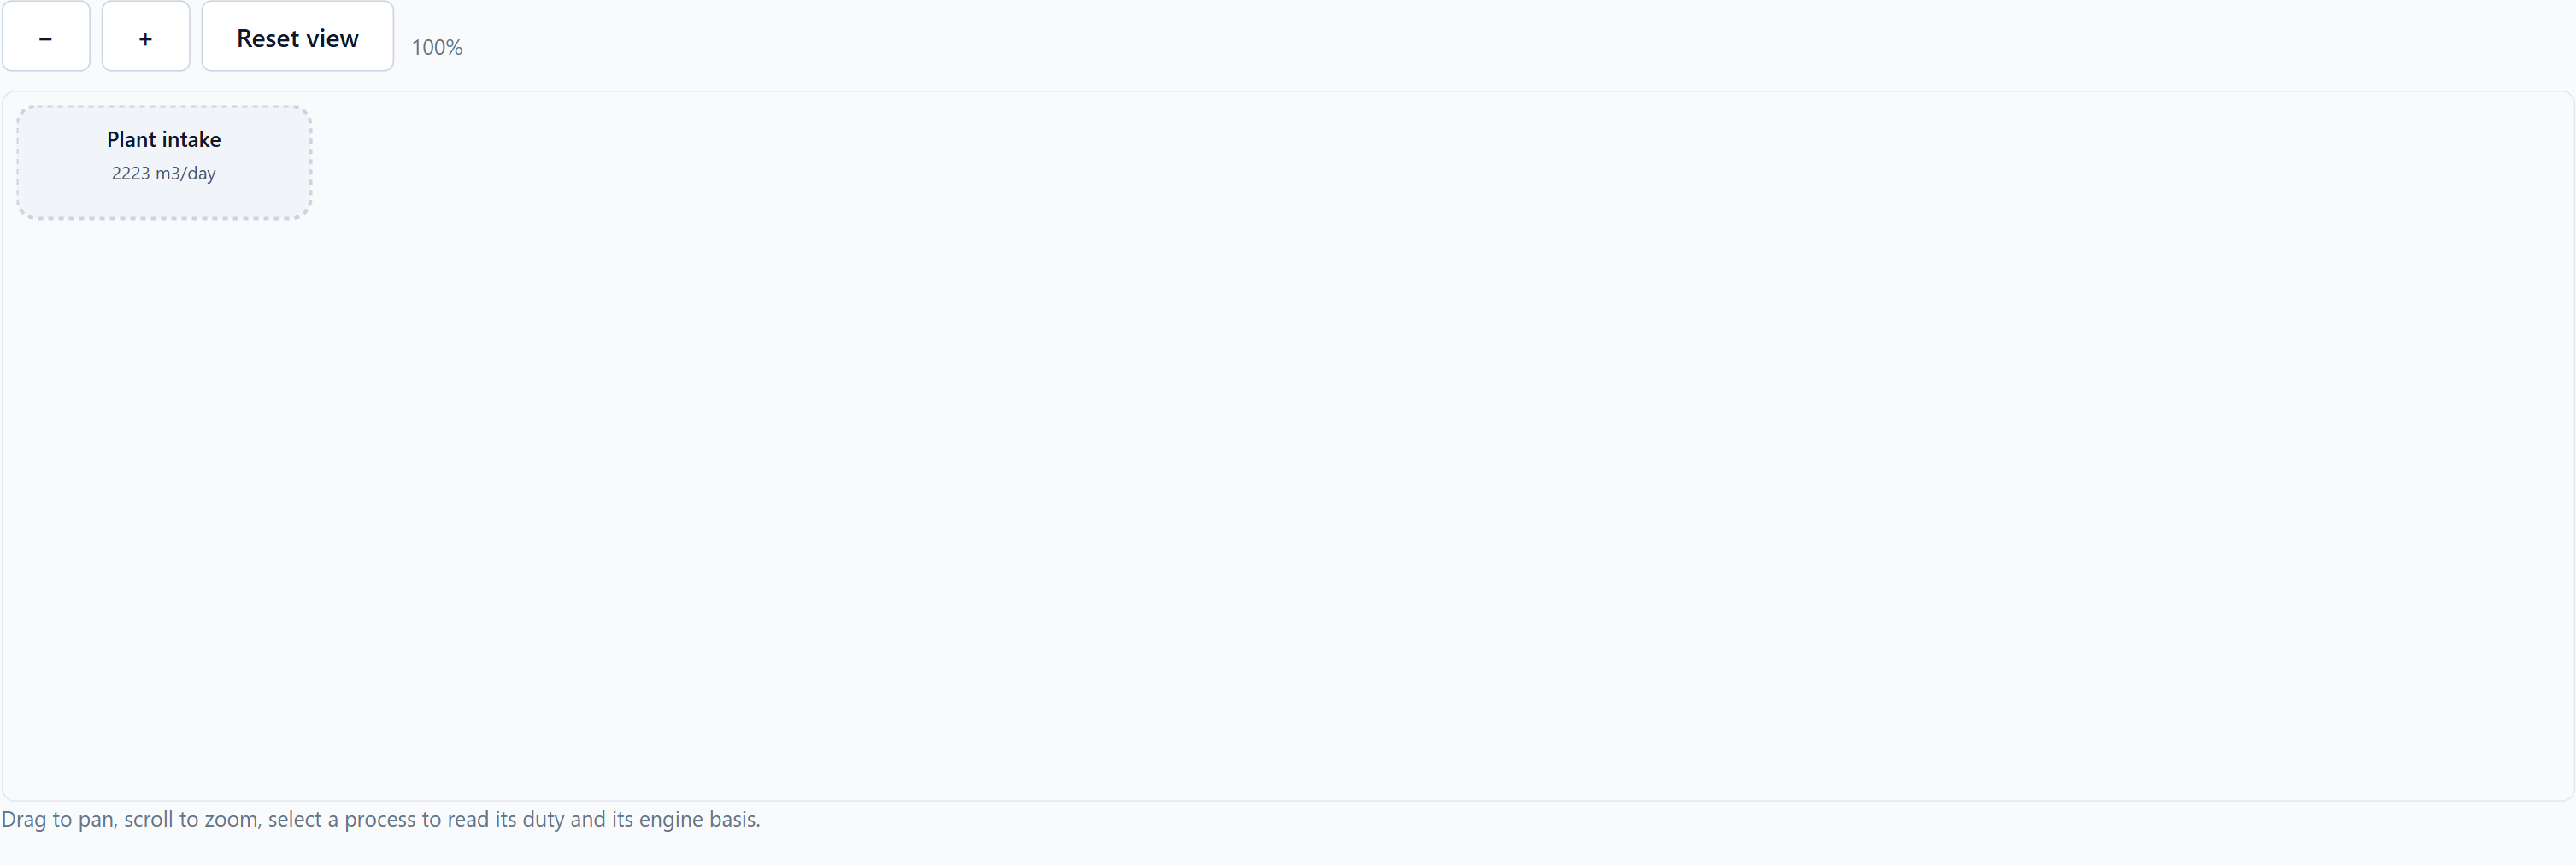
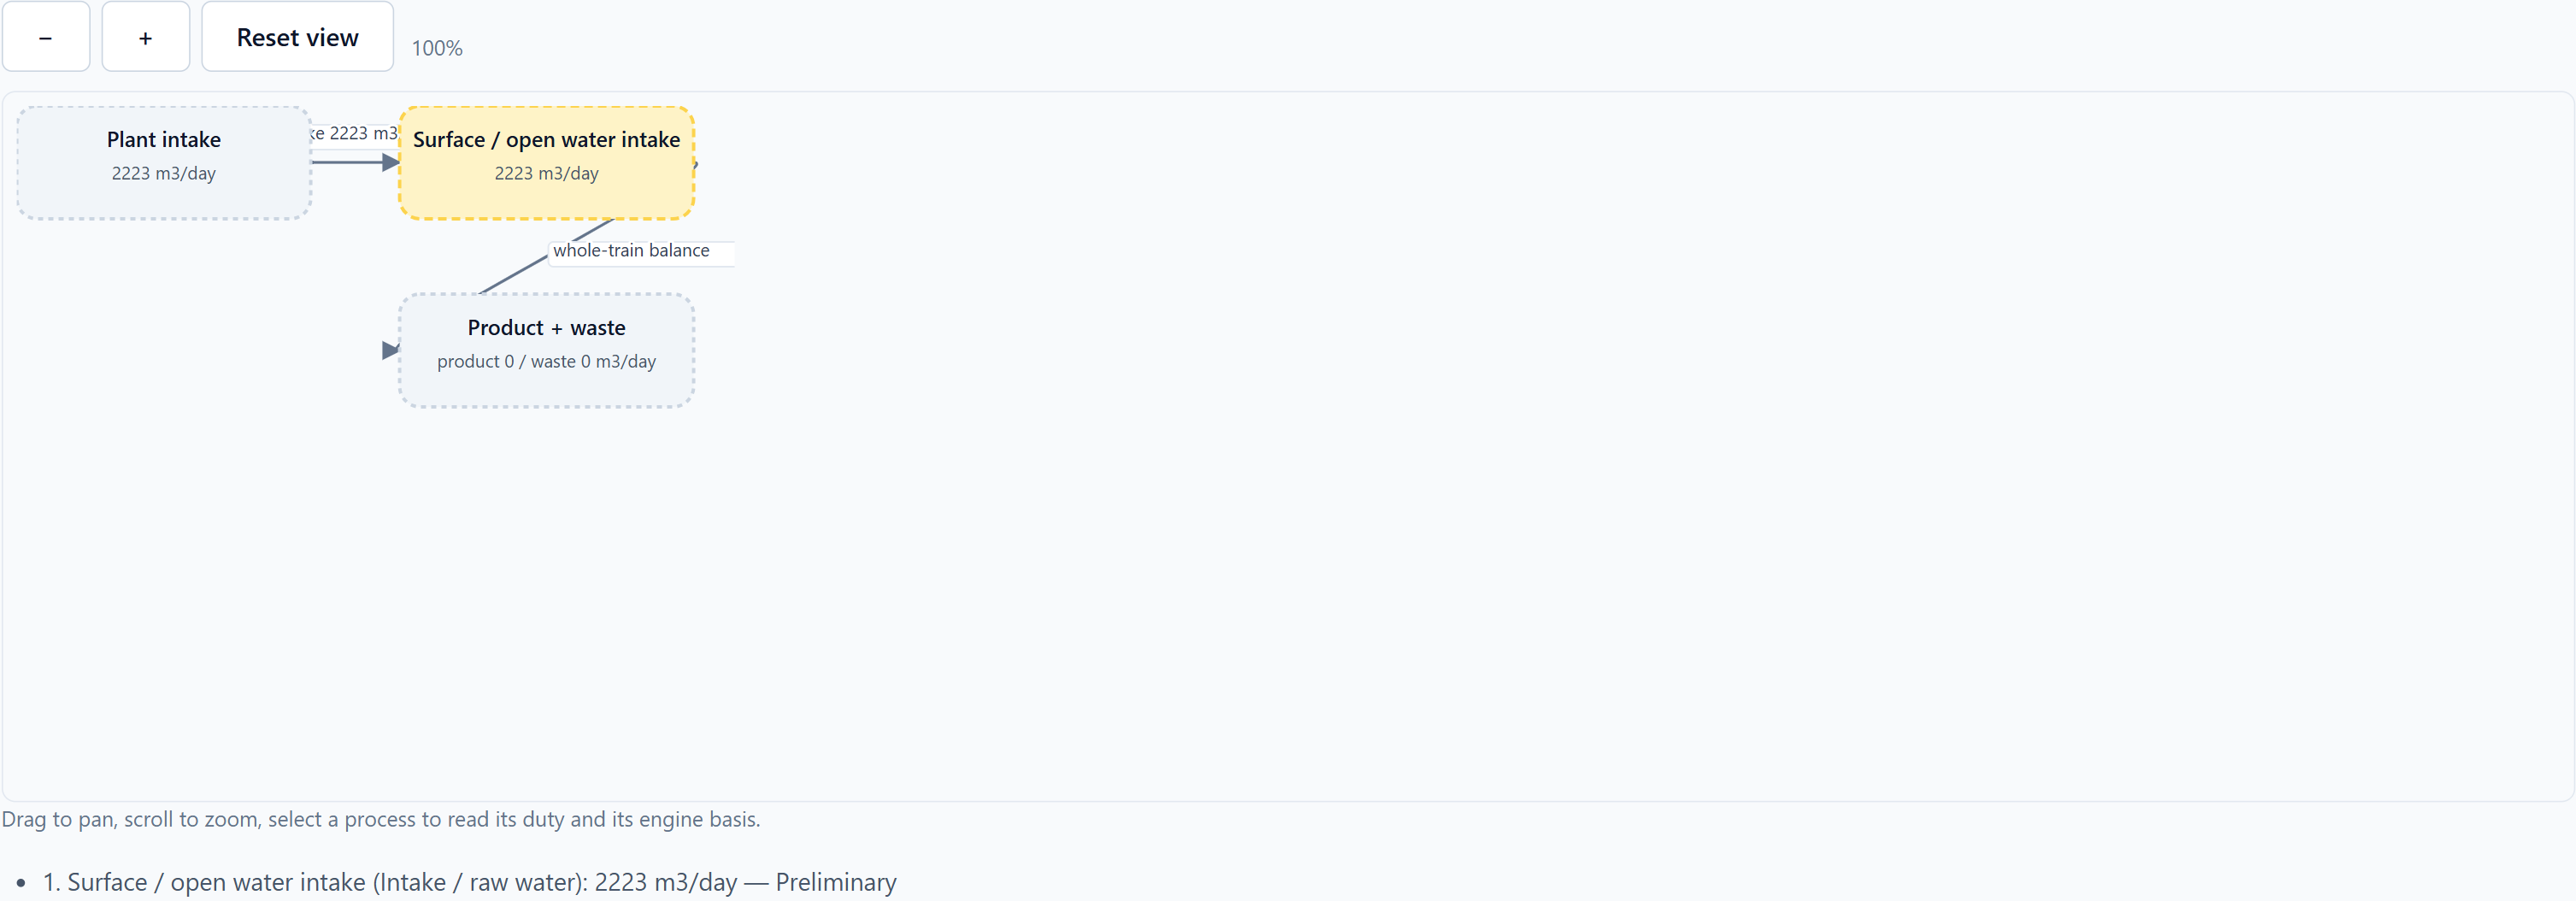
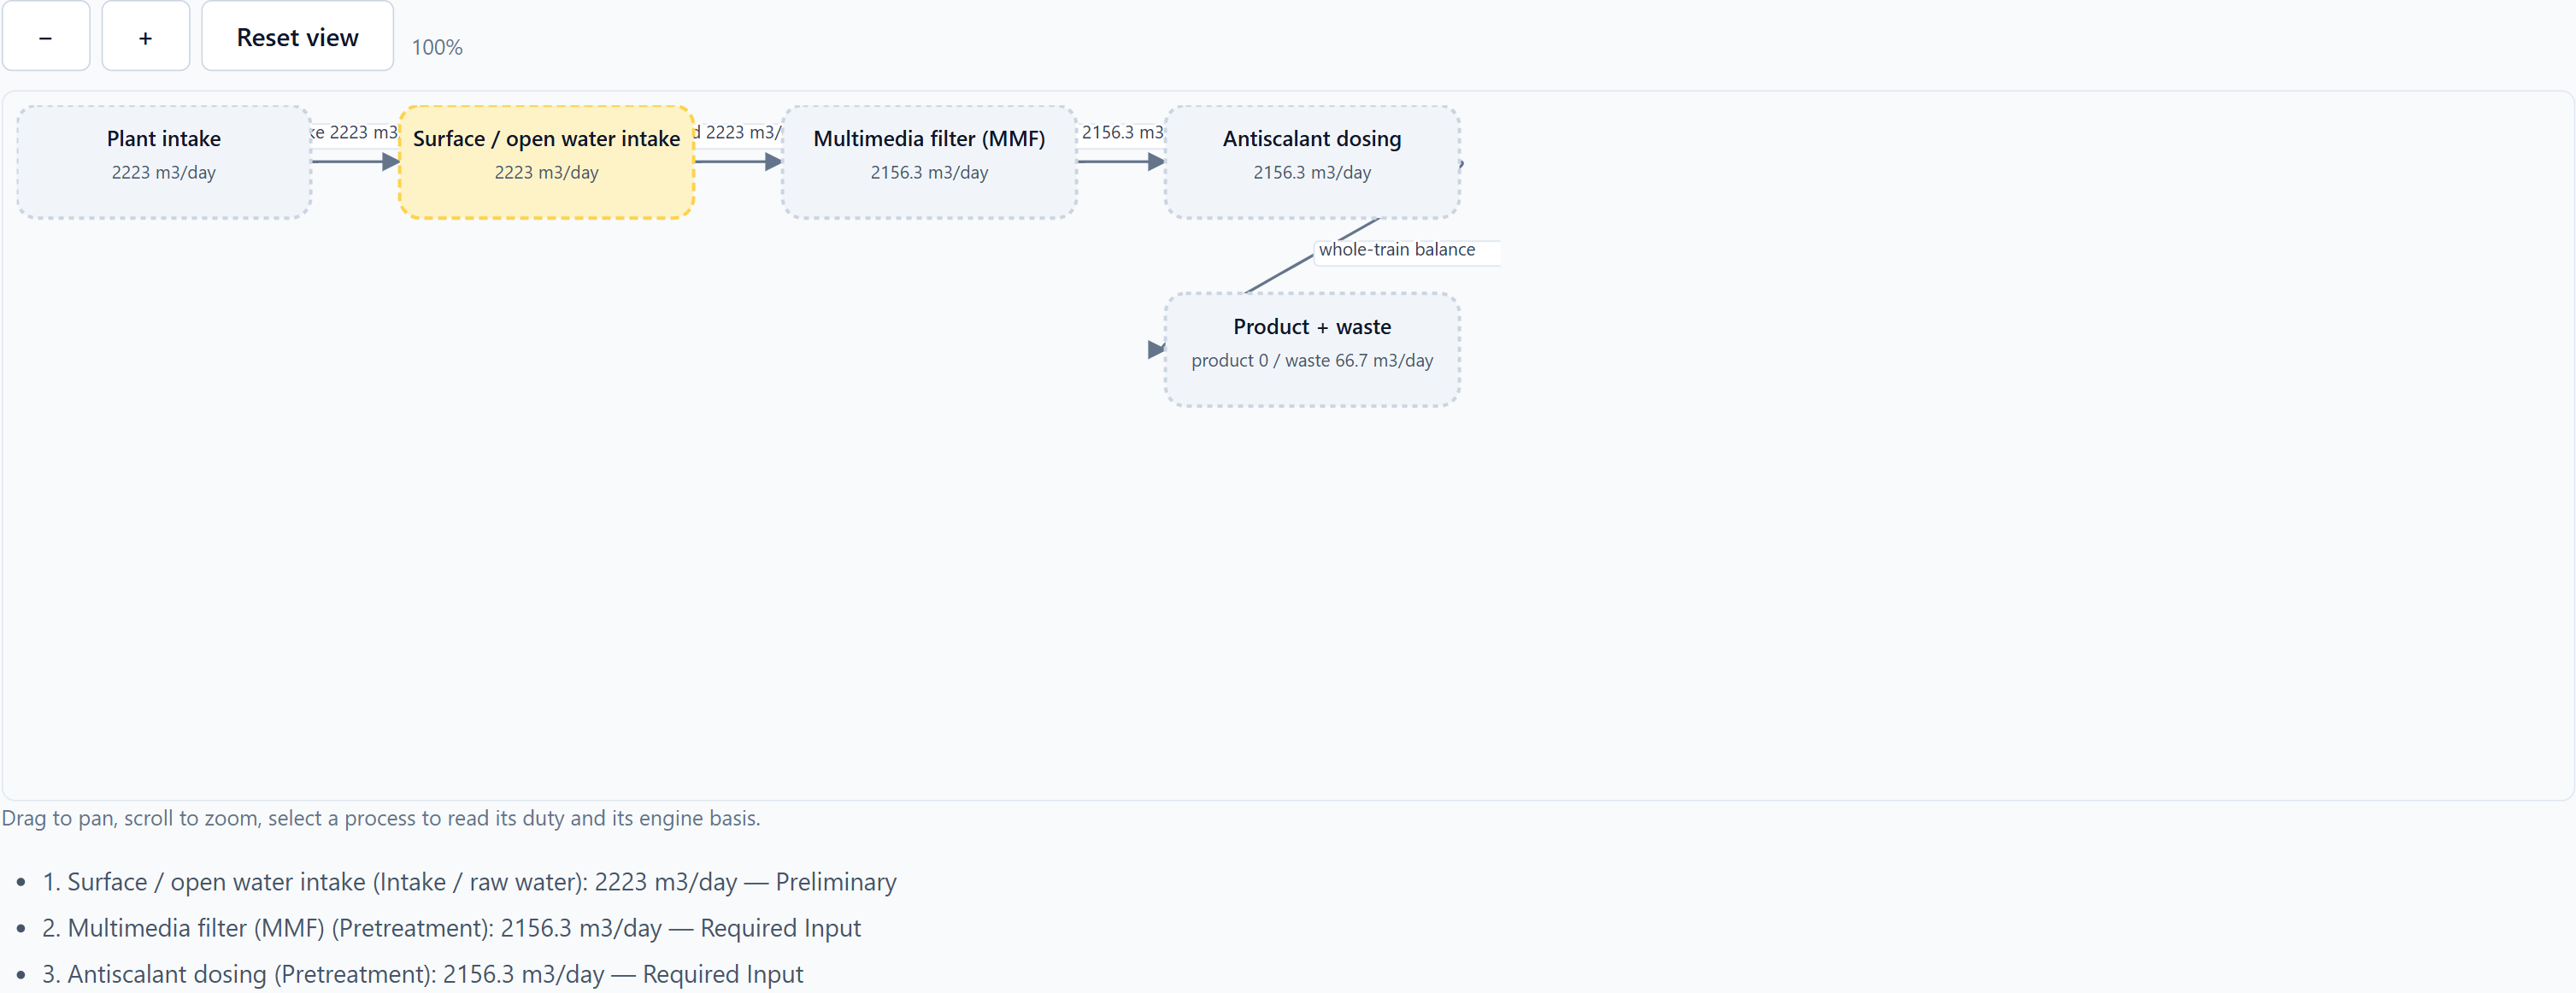
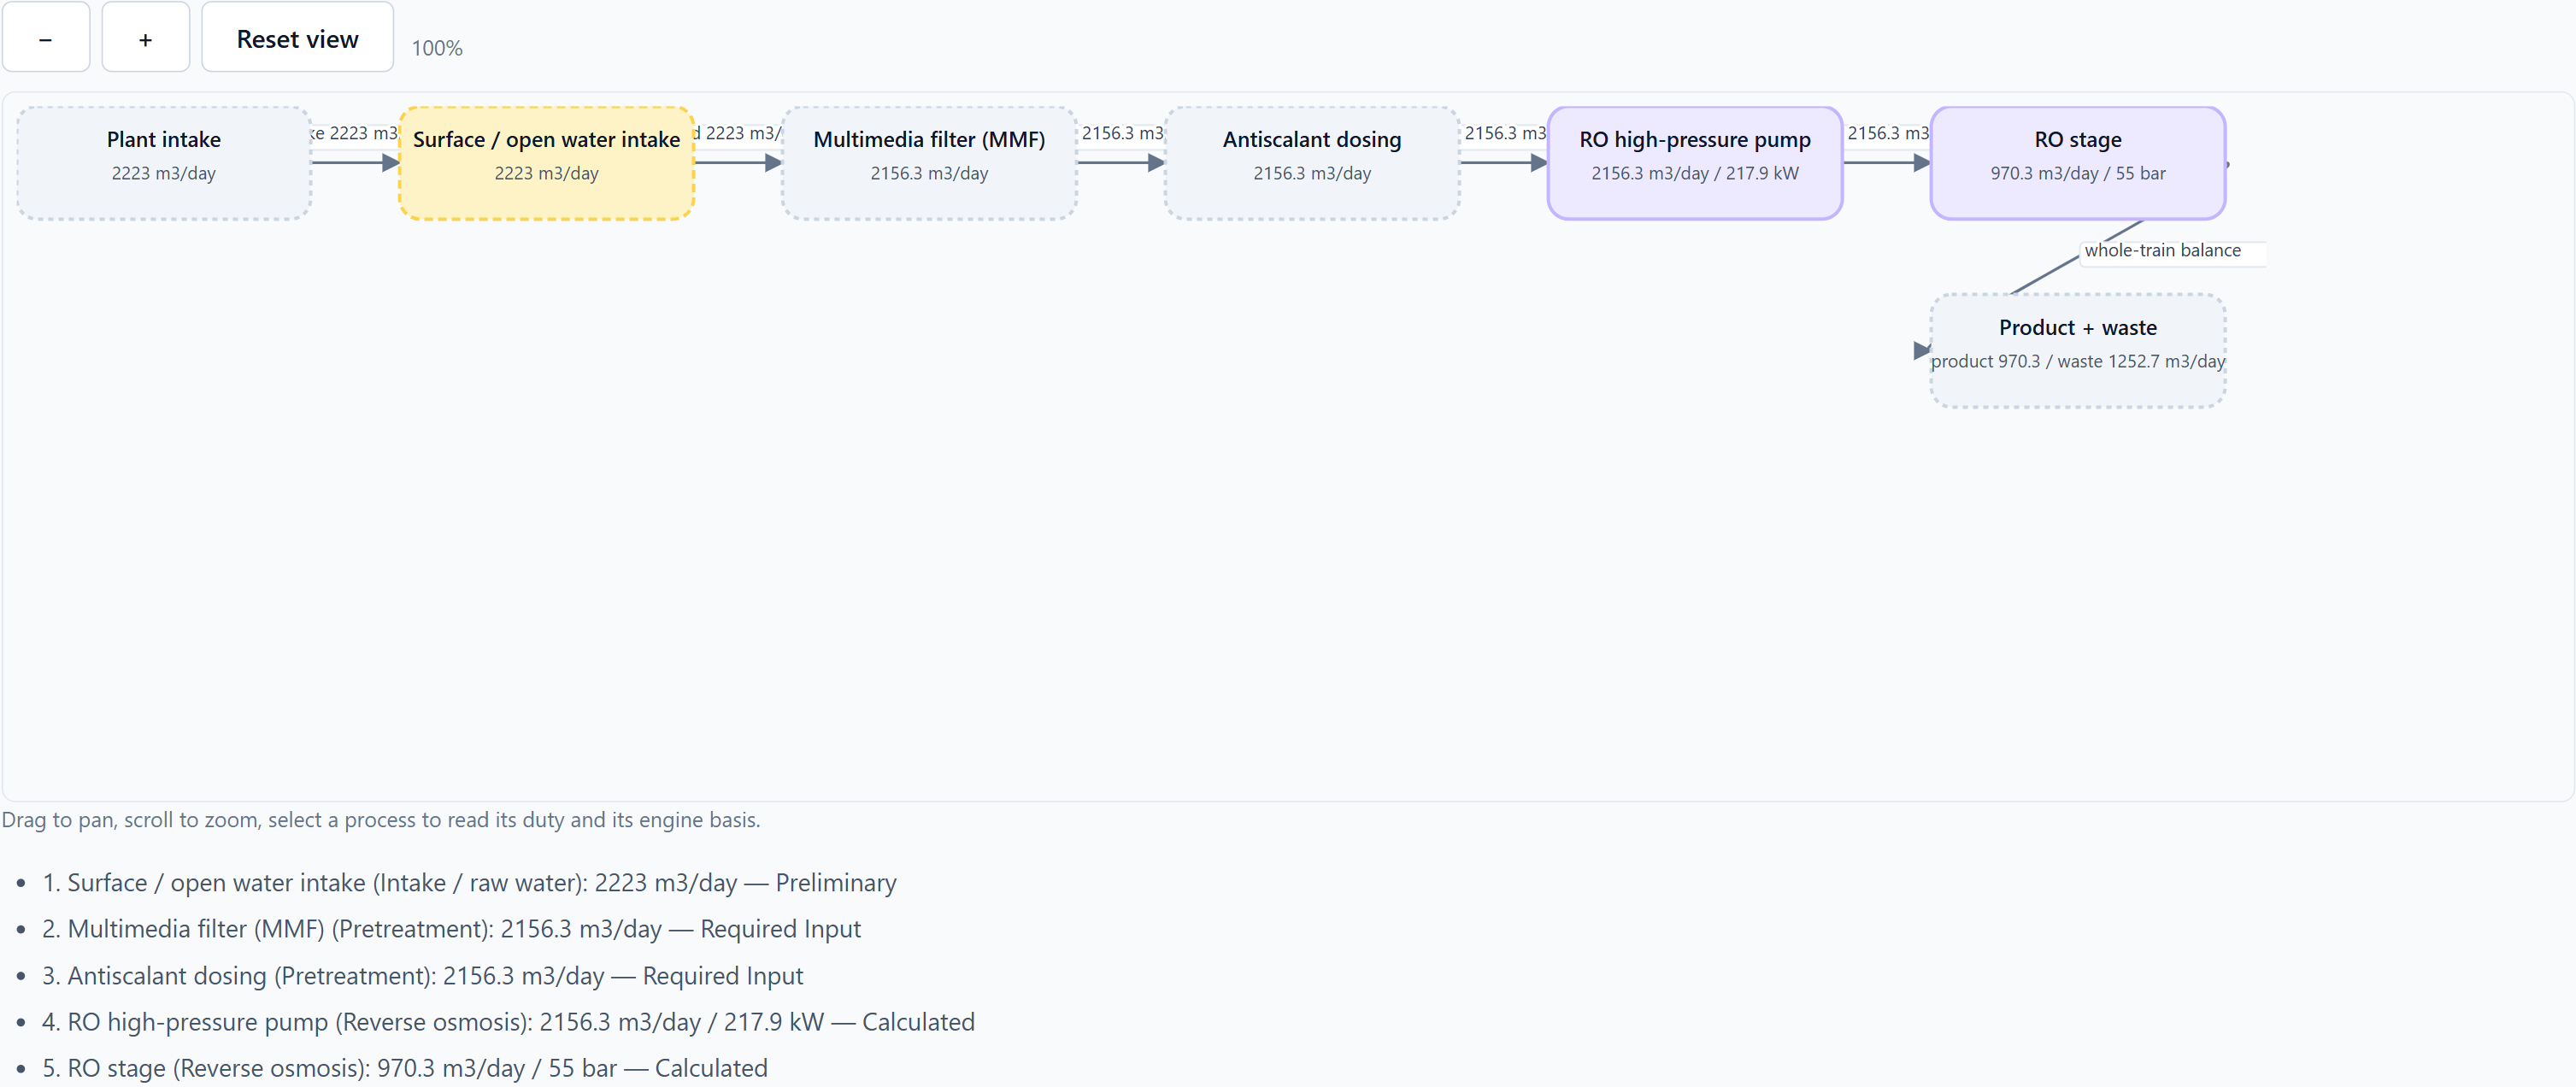
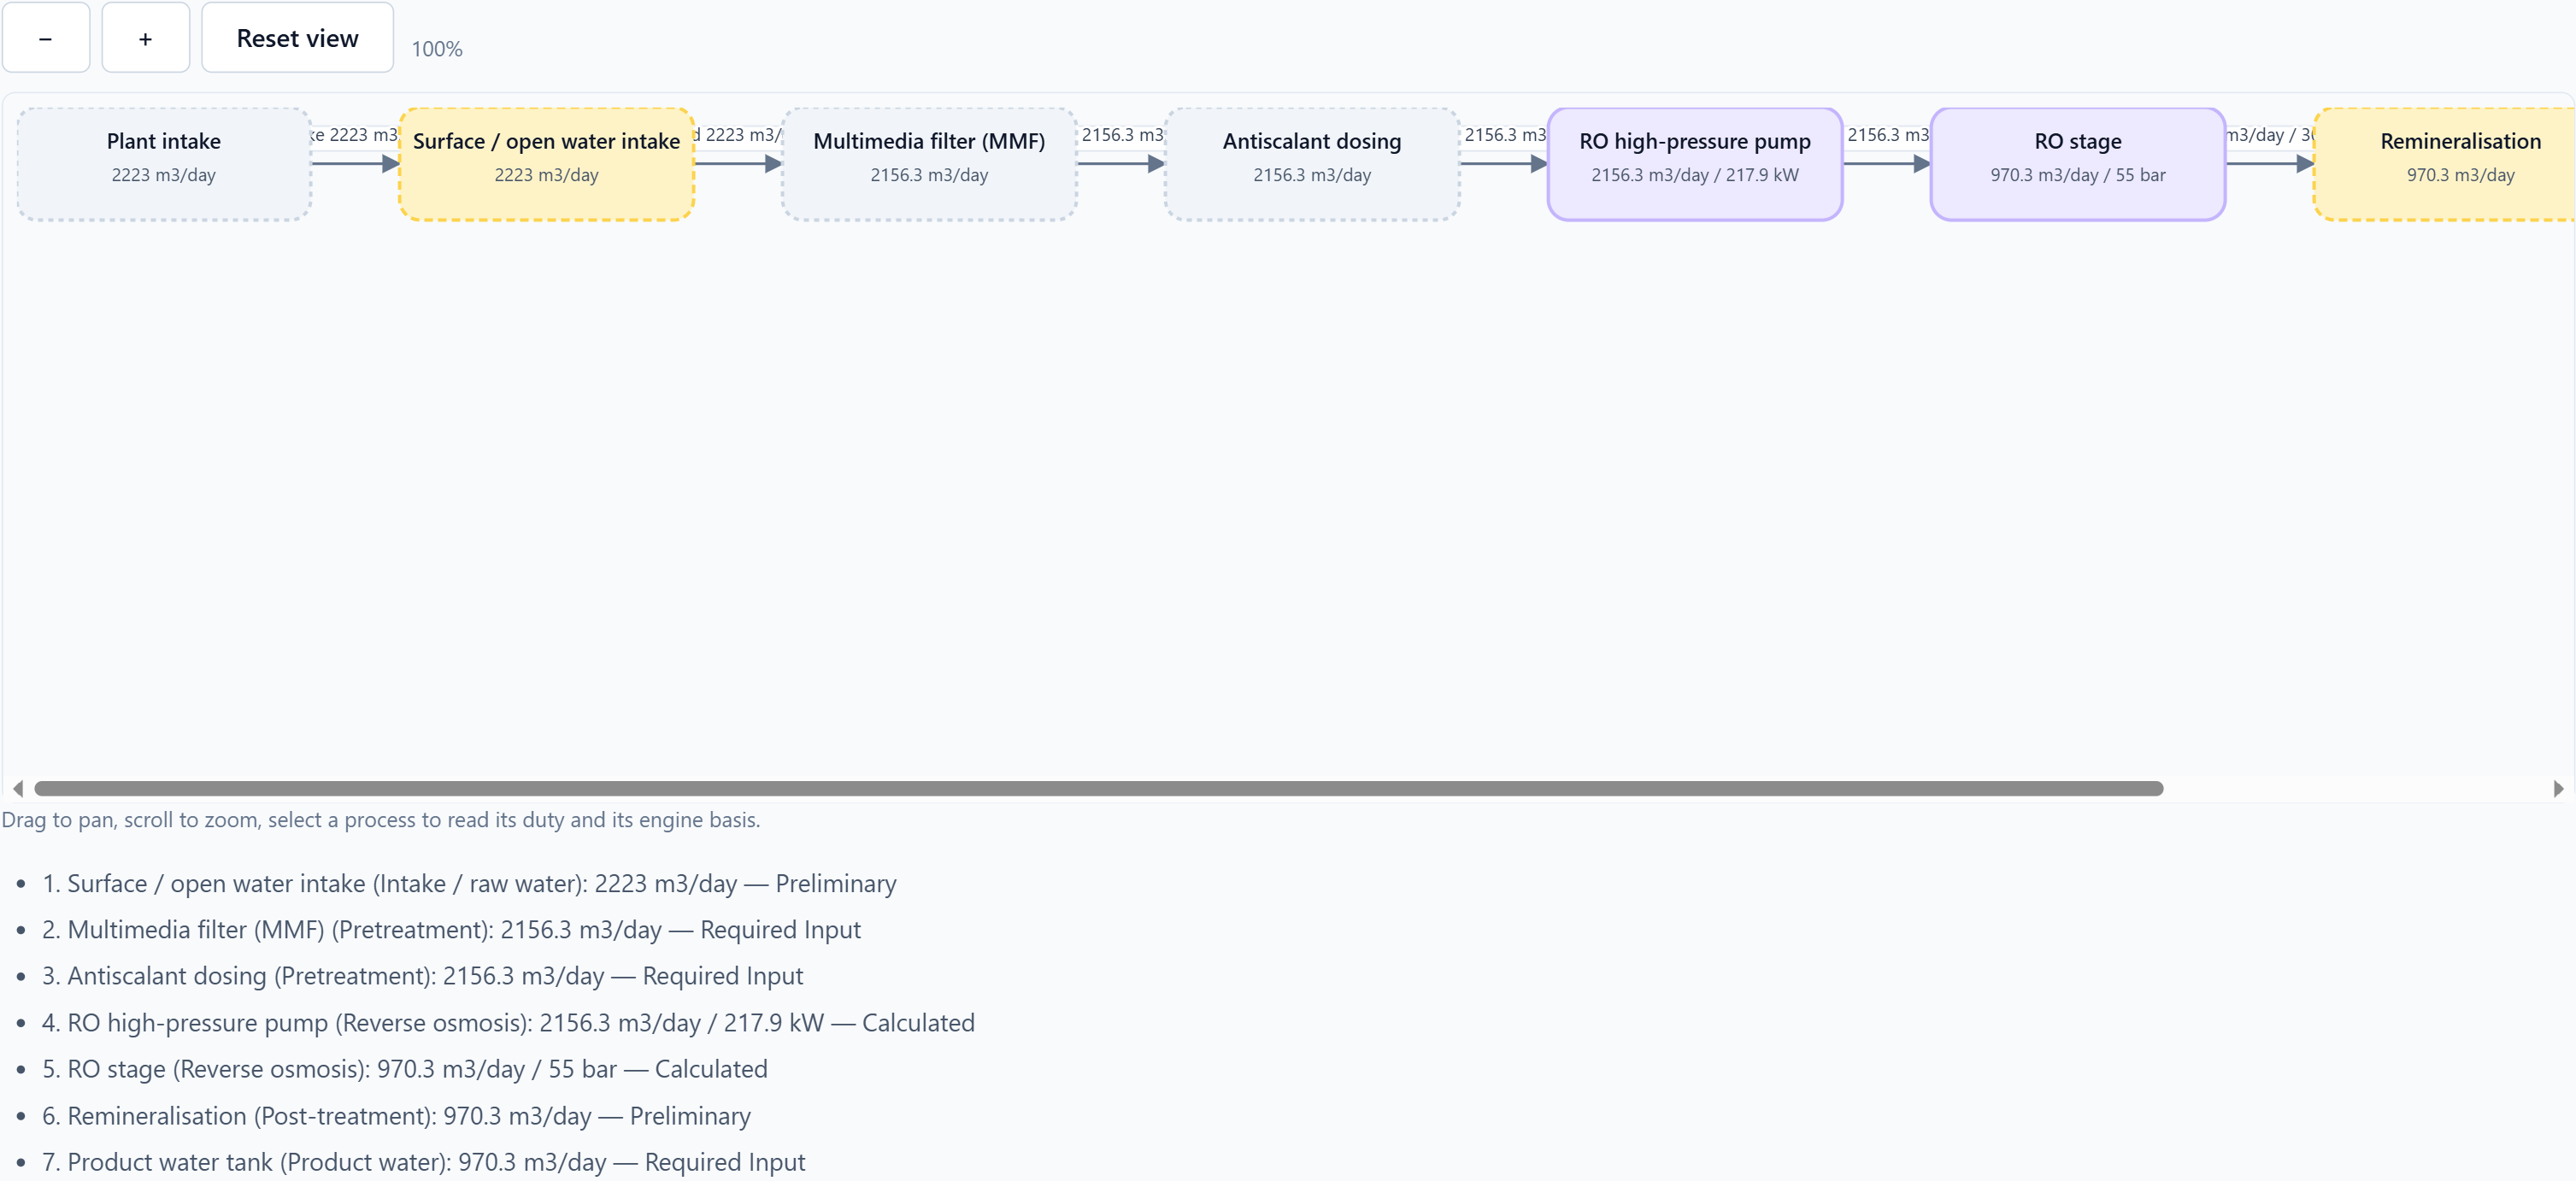
The node count at each stage — 1, 3, 5, 7, 9 — was read back out of the rendered diagram after each change, not estimated. The last figure has exactly the same nine nodes as the report diagram in section 10.
7. Read the design basis and the mass balance
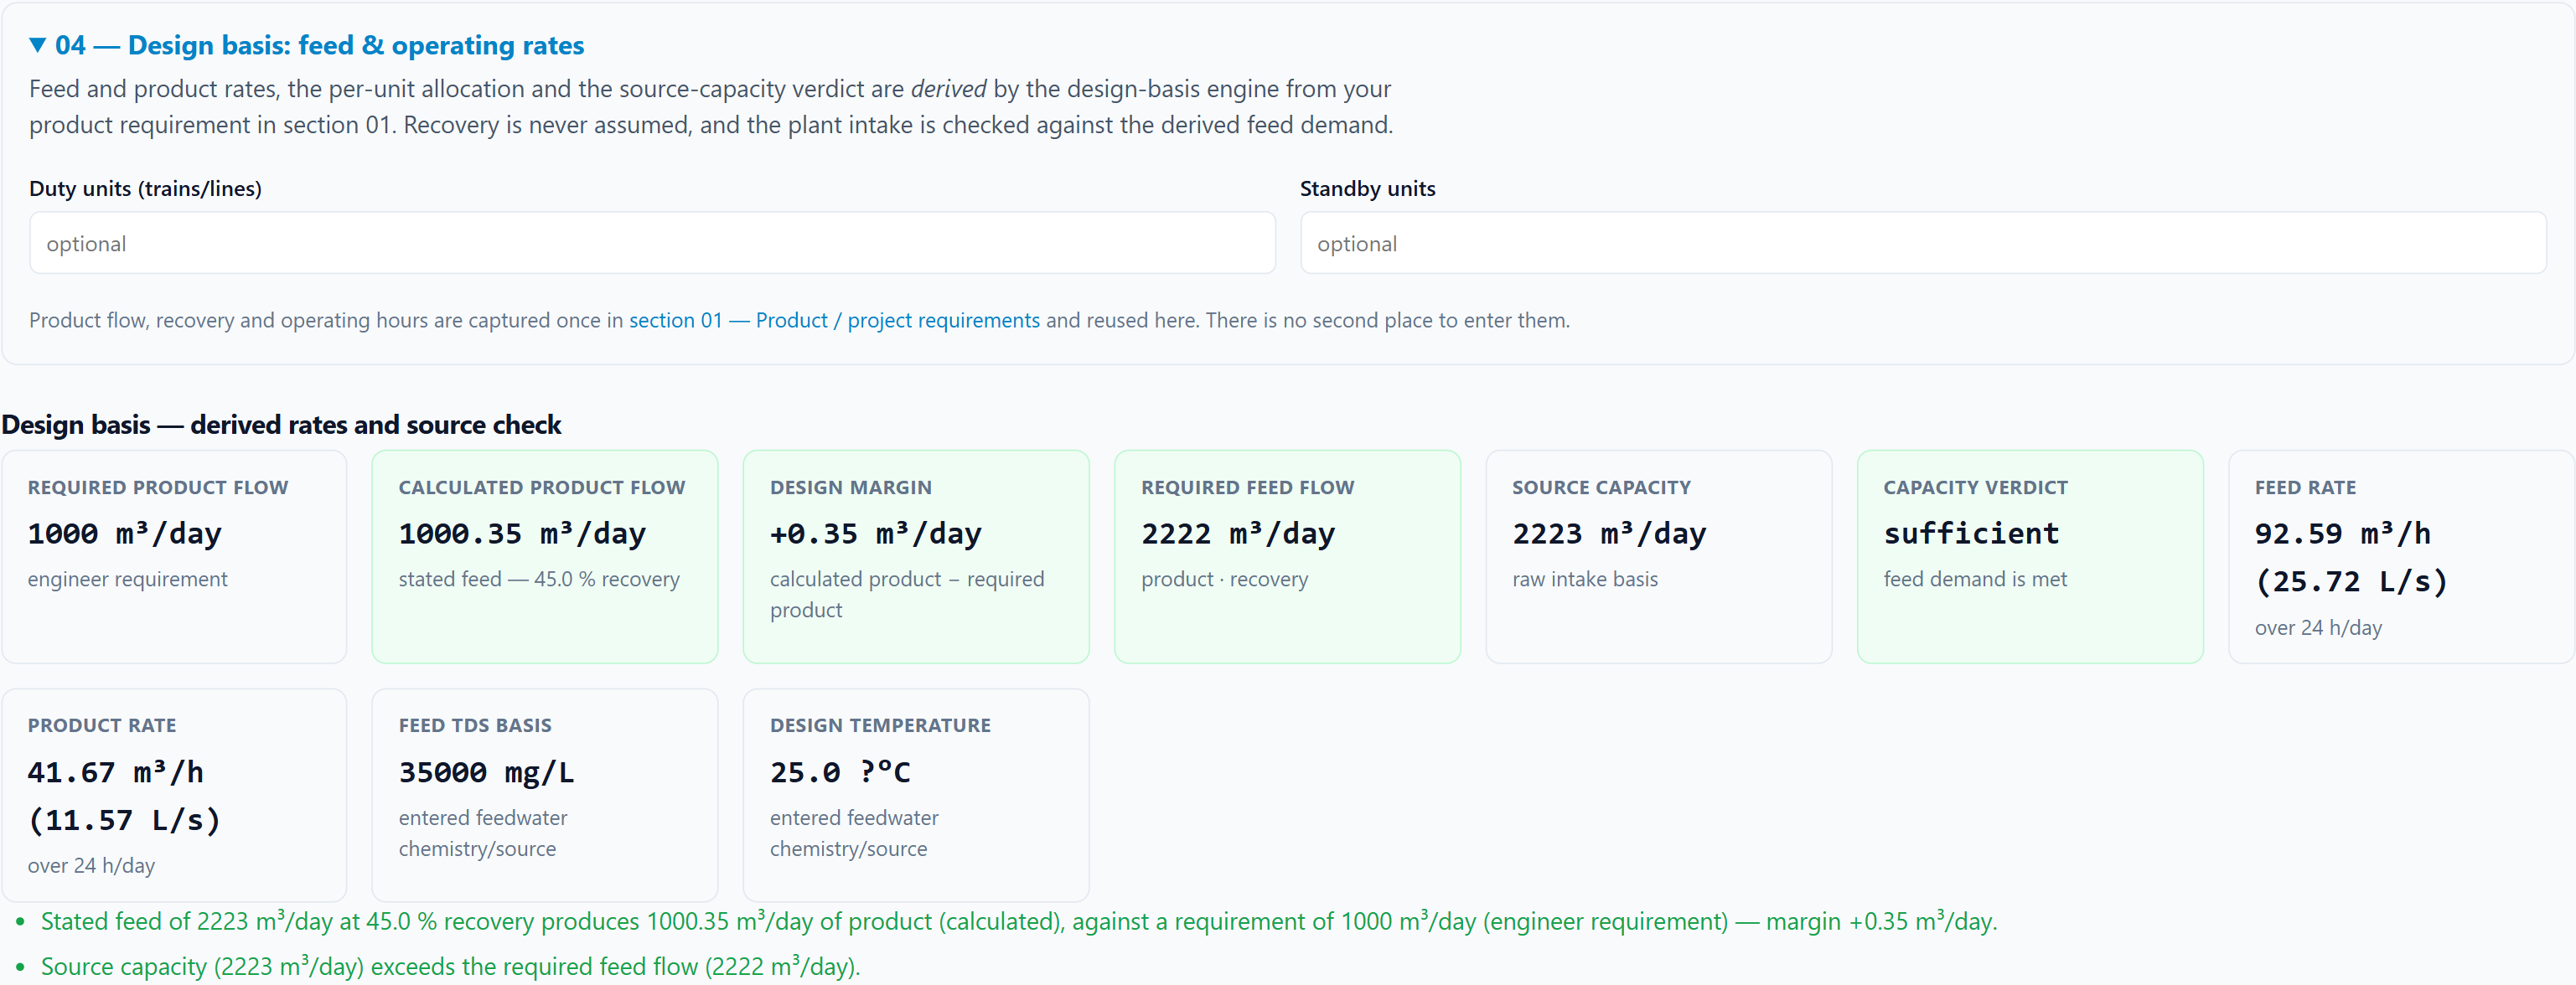
The design basis restates the flows in the units you actually work in, and gives the source-capacity verdict against demand. Product flow, recovery and operating hours are captured once in stage 01 and reused here rather than retyped.
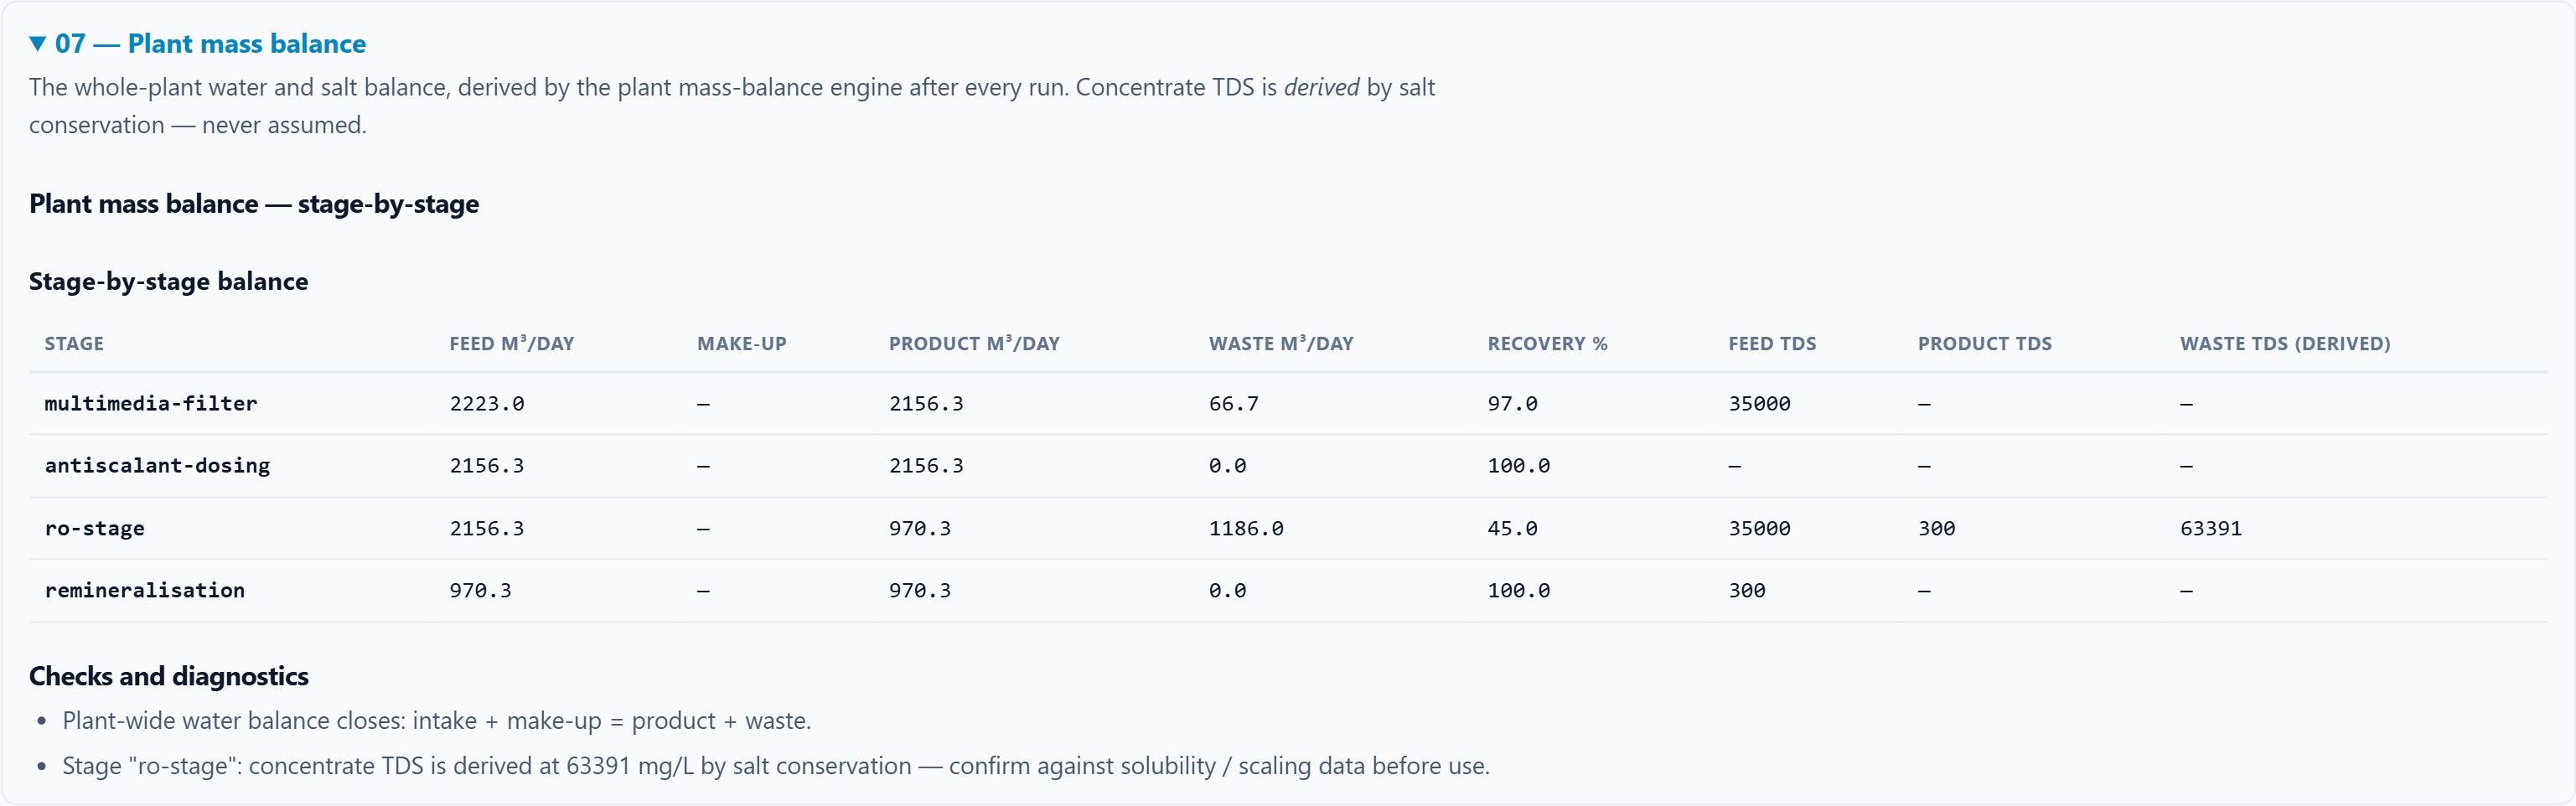
The plant mass balance is where the design is proved. It closes water stage by stage on every run, and it derives the concentrate TDS by salt conservation whenever the ion data supports it. A derived concentrate is always flagged for confirmation against solubility and scaling data.
8. Hand off to equipment
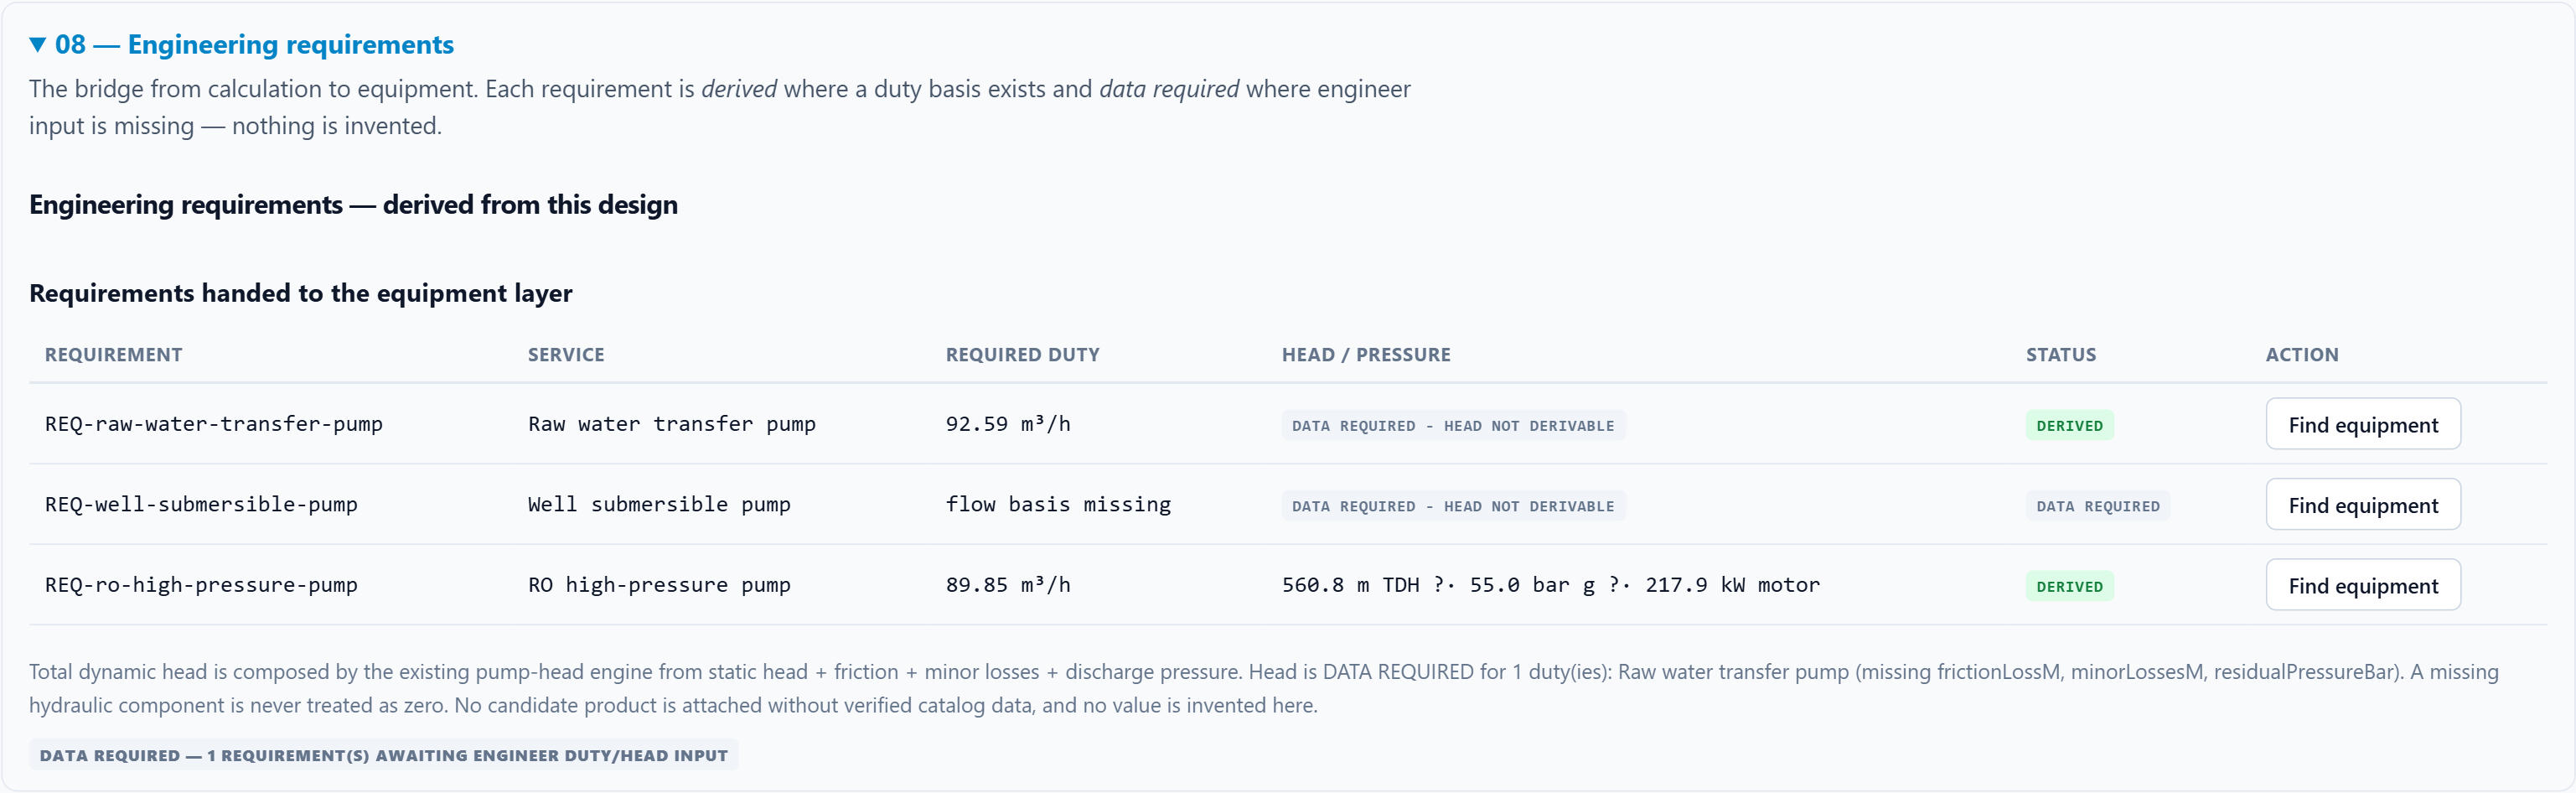
Once a design runs, the tool states the engineering requirements it implies — a raw-water transfer pump, an RO high-pressure pump, and so on — each with the duty, the head or pressure, the calculation that produced it, and the stage it came from.
Where a duty basis exists the requirement is derived. Where your duty or head input is missing it is data required. No value is invented to fill the gap.
From there the chain continues into equipment selection, matching against a verified manufacturer catalog criterion by criterion with you selecting the product, then the equipment schedule, the BOQ where every unpriced line is marked price unavailable, and finally the report.
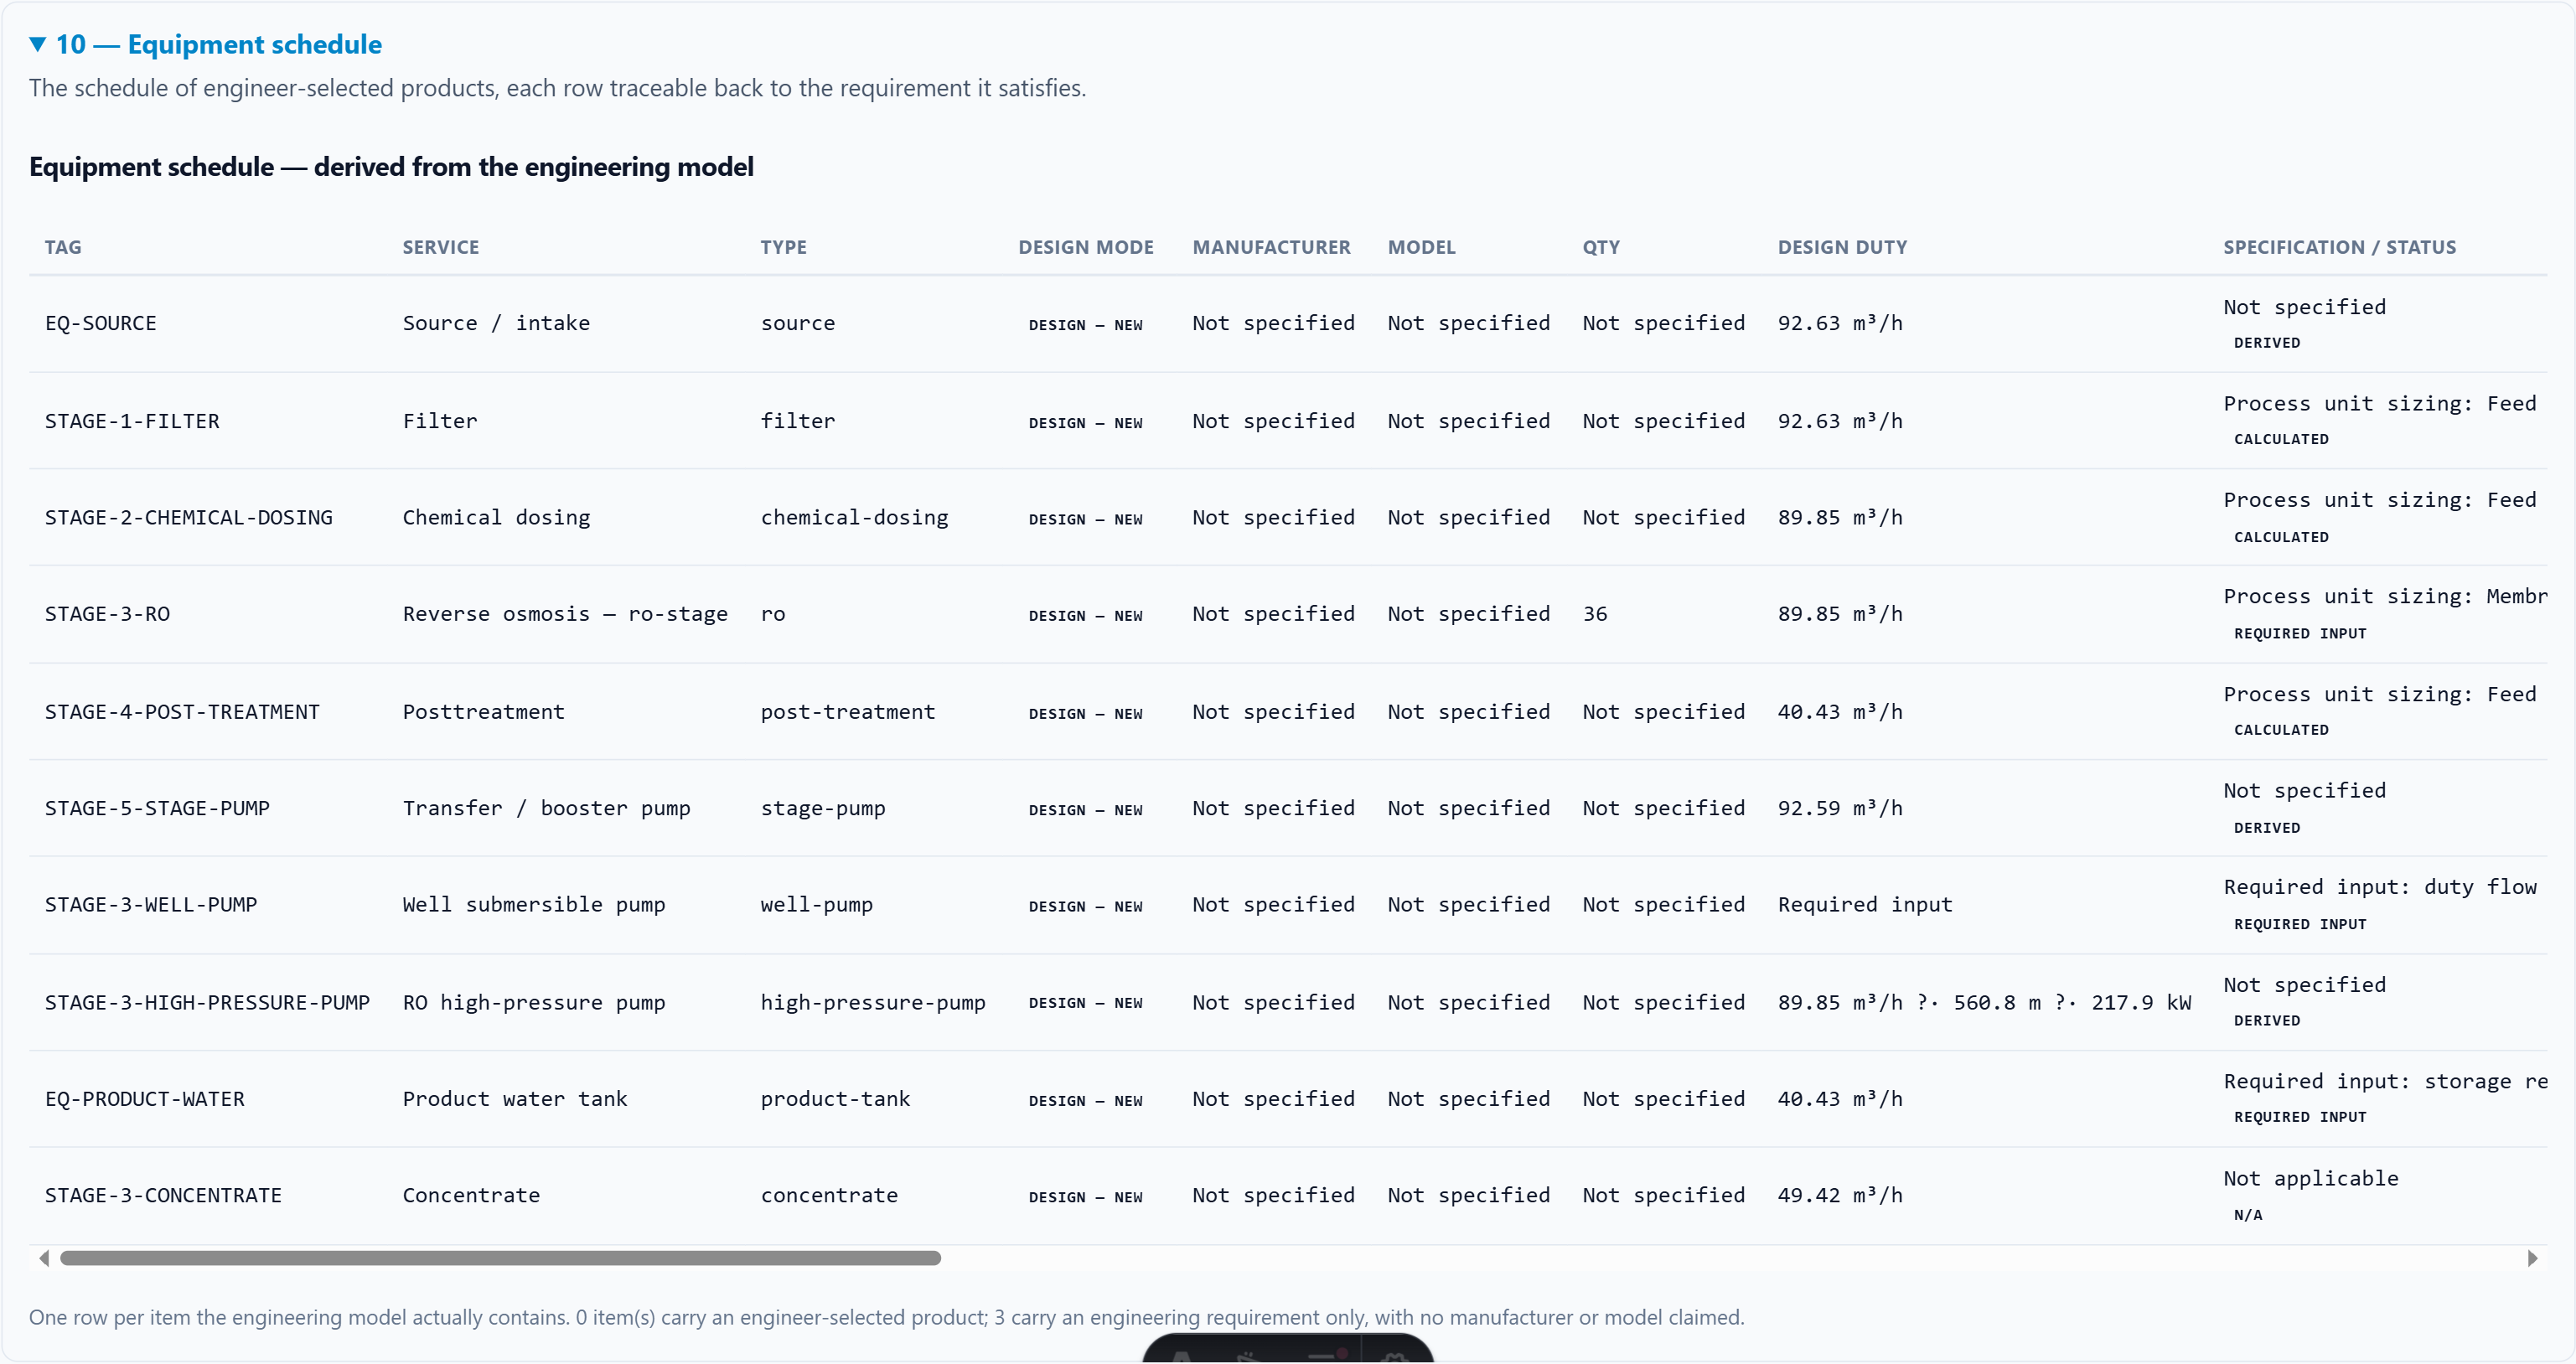
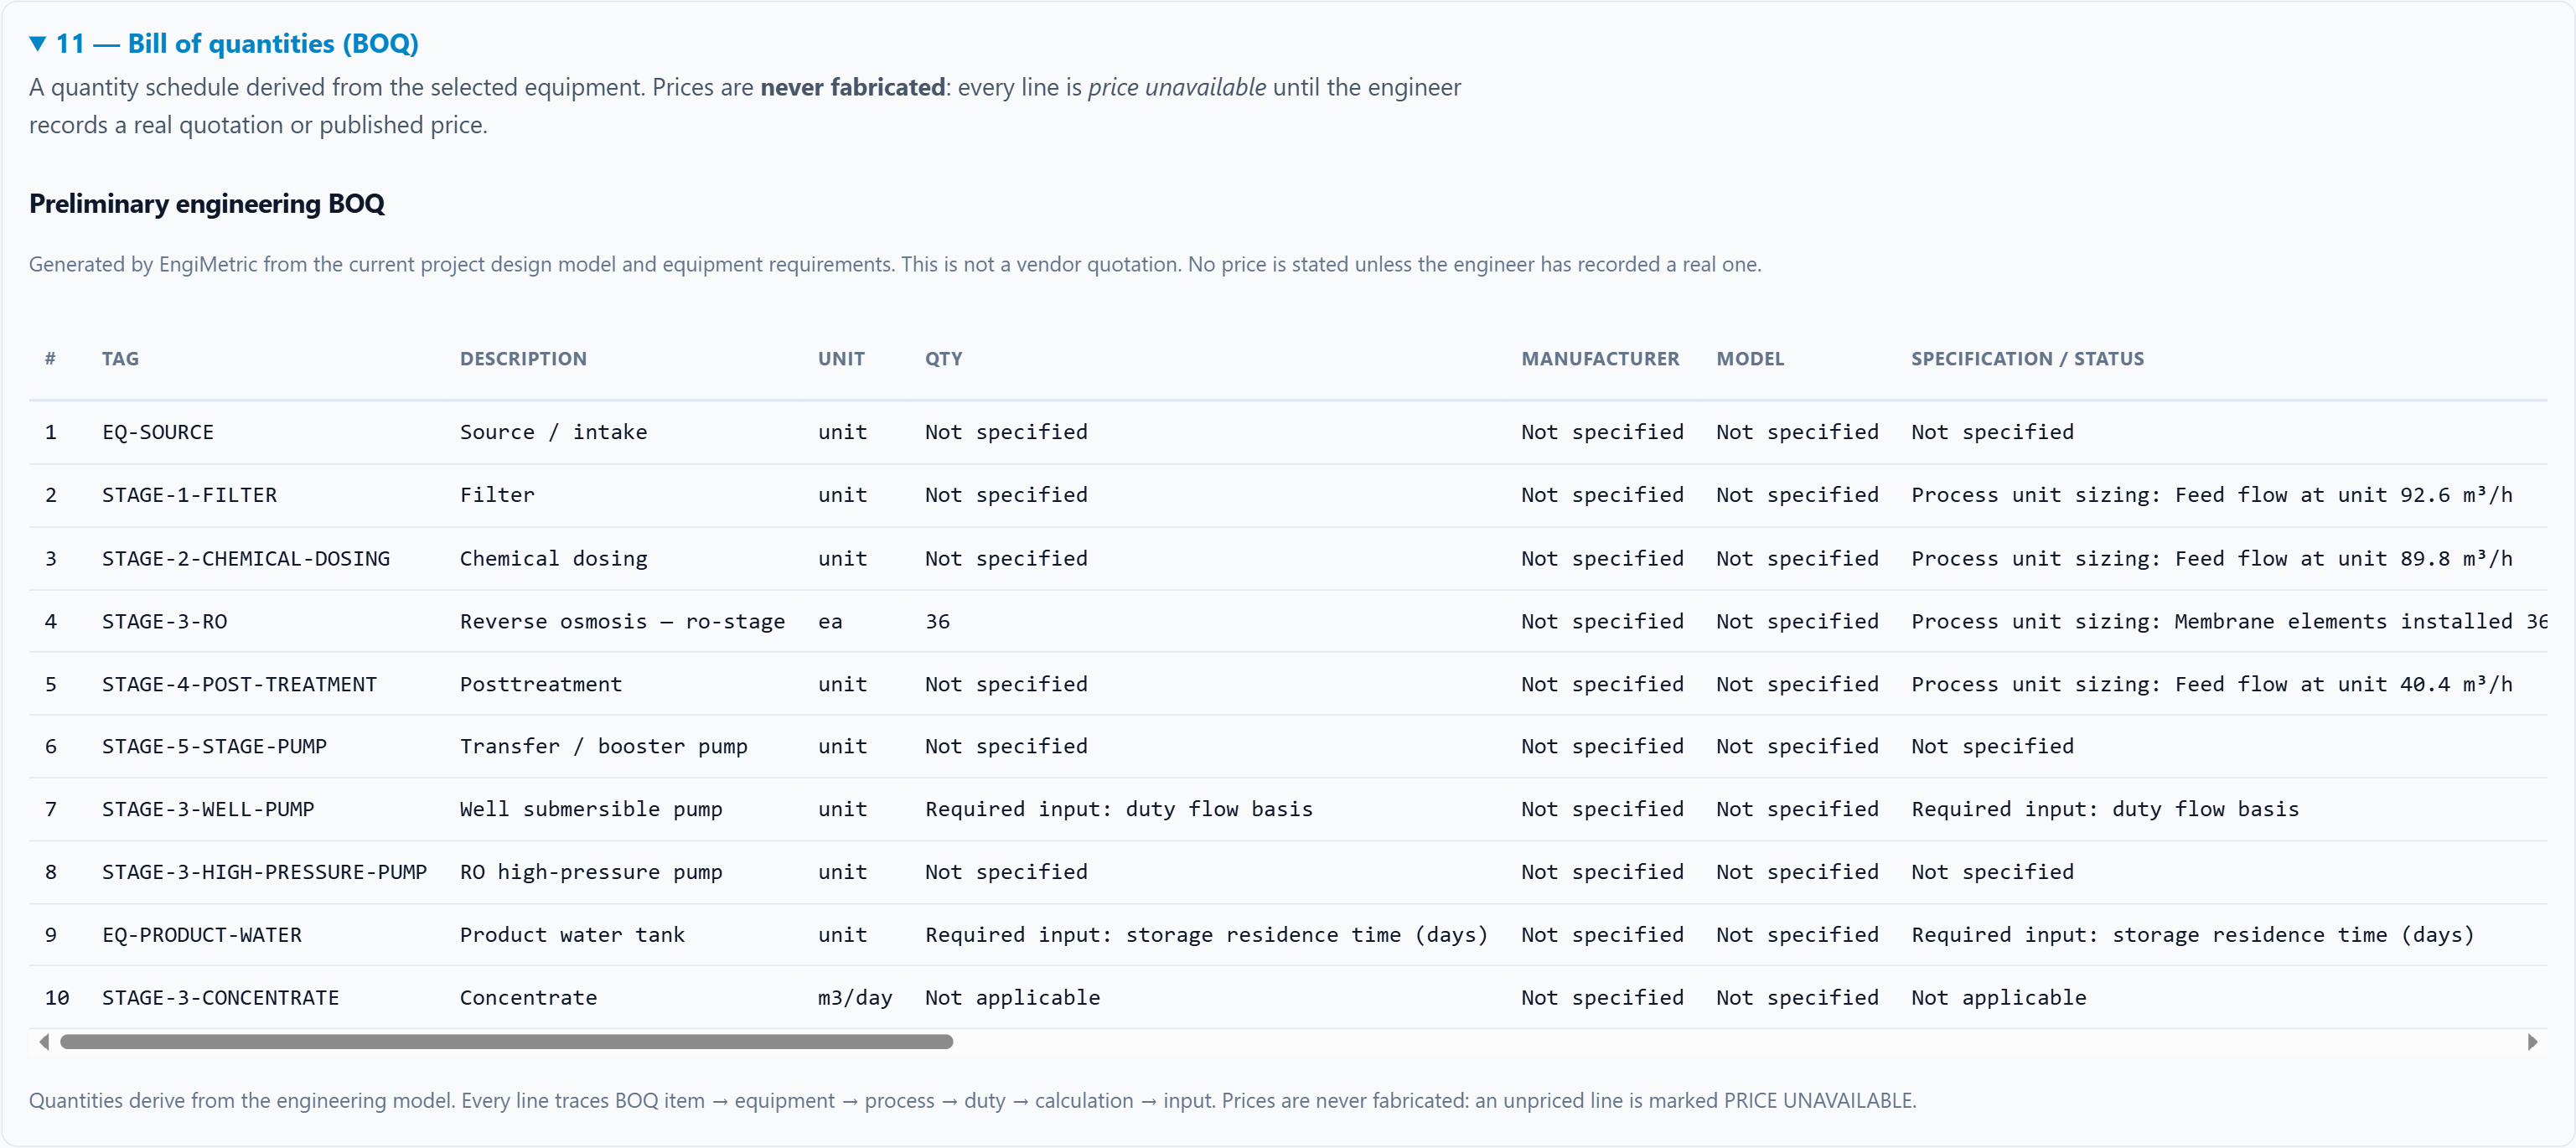
On the worked example, 09 Equipment selection is deliberately left empty. Catalog matching needs engineer duty and head data that this case does not supply, and the tool reports that honestly rather than guessing a candidate.
9. Worked example: Single-Stage RO
This is the built-in Seawater, open intake, single RO
stage demo case (seawater-open-intake). It is one
of five documented starting bases in the designer, and it is a real,
runnable case rather than a picture — you can load it yourself from
the demo panel and every figure below will reproduce.
The stated inputs
These are the values the case loads. They are an illustrative starting basis, not a reference design, not a vendor recommendation and not a compliance case.
| Input | Value | Role |
|---|---|---|
| Required product flow | 1,000 m³/day | engineer requirement |
| Plant recovery | 45 % | engineer target |
| Target product TDS | 300 mg/L | engineer input |
| Raw intake capacity | 2,223 m³/day | stated source capacity |
| Source type | Seawater, open intake | stated |
| Feedwater TDS | 35,000 mg/L | stated analysis |
| Feed temperature and pH | 25 °C and 7.8 | stated analysis |
| Ca / Mg / Na | 400 / 1,200 / 10,500 mg/L | stated analysis |
| Cl / SO₄ / HCO₃ | 19,000 / 2,700 / 150 mg/L | stated analysis |
| Media filter net filtrate recovery | 97 % | stated, not defaulted |
| RO recovery | 45 % | stated |
| RO design flux / element area | 15 L/m²·h / 80 m² | membrane basis |
| Elements per vessel / feed pressure | 6 / 55 bar | membrane basis |
| Static head / pump and motor efficiency | 3 m / 70 % / 90 % | stated |
What the run produced
Every figure in this table was read out of the running application after one run of this case.
| Quantity | Value | Basis |
|---|---|---|
| Required plant intake | 2,222 m³/day | derived, product ÷ recovery |
| Stated source capacity | 2,223 m³/day | stated, verdict sufficient |
| Intake rate | 92.59 m³/h (25.72 L/s) | derived over 24 h/day |
| Product rate | 41.67 m³/h (11.57 L/s) | derived over 24 h/day |
| Filter product | 2,156.3 m³/day at 97.0 % | derived |
| RO product | 970.3 m³/day at 45.0 % | derived |
| RO waste, concentrate | 1,186.0 m³/day | derived |
| RO product TDS | 300 mg/L | stated target |
| RO concentrate TDS | 63,391 mg/L | derived by salt conservation, verify against scaling data |
| RO high-pressure pump duty | 89.85 m³/h, 560.8 m TDH, 55.0 bar g, 217.9 kW motor | derived |
| Raw-water transfer pump duty | 92.59 m³/h, head data required | derived flow, head not derivable |
| Plant-wide water balance | closes: intake plus make-up equals product plus waste | checked |
One detail is worth pointing out, because it is the kind of thing this tool exists to make visible. The design basis panel reports the calculated product as 1,000.35 m³/day against a required 1,000 m³/day, a margin of +0.35 m³/day, and it bases that on the stated 2,223 m³/day intake. The mass balance below it, walking the filter and RO stages in turn, lands on 970.3 m³/day. The two figures are answering different questions — the first is the product implied by your stated intake and recovery, the second is what the configured chain actually delivers once the filter’s own recovery is applied — and reading them side by side is how you catch a basis that looks adequate on paper and falls short once the stages are real.
The concentrate TDS of 63,391 mg/L is derived, not asserted, and the report flags it for confirmation against solubility data before you size anything around it.
10. The engineering report
The report is the deliverable. It carries the project basis, the traceability chain from BOQ line back to the originating calculation, the process-flow diagram, the mass balance and the stated assumptions, together with a reference disclaimer, because a preliminary calculation is not a construction package.
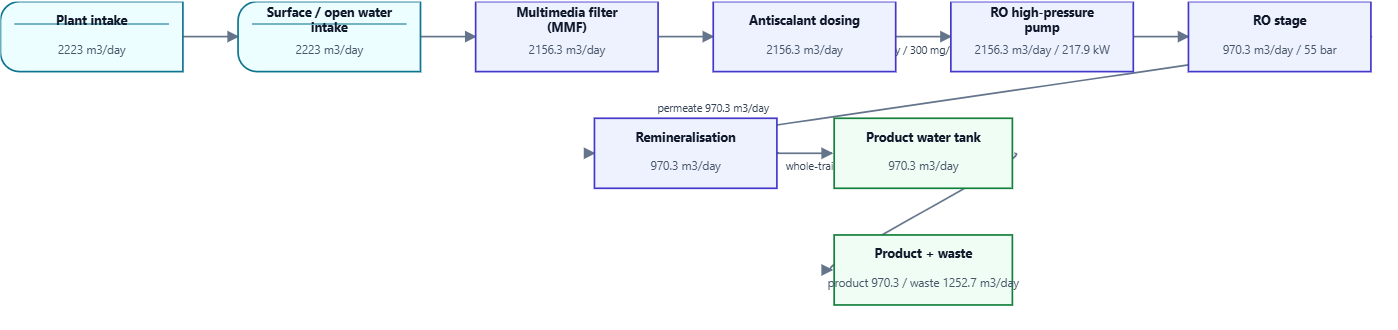
Observed properties of the current report, read from the rendered document: 21 sections, 7 engineering tables, a process-flow diagram of 9 nodes, and reader-formatted timestamps with no raw ISO string leaking into the visible text.
The worked example’s full report is published alongside this guide as a PDF you can open, so you can check these claims against the artefact itself.
11. Before and after
Read this first
The before artefact is a preserved engineering report kept in the
EngiMetric-Demo-Gallery folder under
01-Single-Stage-RO. It was recorded from a
different input set to the
seawater-open-intake case worked through above: it shows
an intake of 1,250 m³/day against a required product of 500 m³/day at
40 % recovery, where the demo case is 2,223 m³/day, 1,000 m³/day and
45 %.
So this section is not a claim that one design’s numbers improved. It compares two things that do not depend on the input values: how the report is structured, and what the diagram is drawn from. Every before figure below was read out of that preserved report’s own first page and its saved application snapshot.
| Property | Before, preserved report | After, current application |
|---|---|---|
| Report length | 9 pages | 6 pages |
| Report sections | 21 | 21 |
| Engineering tables | 0 | 7 |
| Process-flow diagram nodes | 10 | 9 — seven process steps plus two terminals |
| What the diagram is drawn from | the equipment requirement set, so requirement pumps appeared as process nodes | the configured treatment train only |
| Timestamps in the document | three raw ISO stamps, two of them differing only in milliseconds | one formatted Generated line and one Captured line, no raw ISO |
The change that matters: what the diagram is drawn from
In the preserved report the process-flow diagram was built from the equipment requirement set. That placed pumps that are equipment requirements into the middle of the process chain, alongside genuine process stages. Its ten nodes were:
- Source / intake — 728 m3/day, 58133 mg/L
- RO high-pressure pump — 1250 m3/day
- Transfer / booster pump — 50.5 m3/h, 530 m
- Filter — 1250 m3/day
- Chemical dosing — 1213 m3/day
- Well submersible pump — 17.4 m3/h
- Reverse osmosis, ro-stage — 1213 m3/day
- Post treatment — 485 m3/day
- Concentrate — 728 m3/day
- Product water tank — 485 m3/day
In the current application the diagram is built from the configured treatment train — the seven processes the engineer actually configured, framed by the plant’s two boundary terminals. Its nine nodes are:
- Plant intake (terminal)
- Surface / open water intake
- Multimedia filter (MMF)
- Antiscalant dosing
- RO high-pressure pump
- RO stage
- Remineralisation (Preliminary)
- Product water tank
- Product and waste (terminal)
This is the substantive correction. An engineering requirement is a consequence of the design; a process stage is the design. Drawing the process diagram from the requirement set both invented process steps the engineer never configured and obscured which steps were actually in the train.
The second correction is presentation. The preserved report carried three raw ISO timestamps, two of them differing only in milliseconds, because a machine timestamp was written straight into the document. The current report formats its timestamps for a reader, states a single generation time, and renders its tabular engineering data as real tables rather than run-together text.
12. What this tool does not do
A guide that lists only strengths is not much use. EngiMetric does not select equipment, vessels, pumps or vendors; it does not price anything; it is not an IFC or approved-for-construction package and it cannot stamp or certify a design.
A design carrying missing or preliminary values is a preliminary design and must not be presented as final. Every worked figure in this guide is subject to that limitation, including the Single-Stage RO case.
Known limits of this guide
- The screenshots were captured from a desktop Chrome session at a 1600 px viewport. The designer is responsive, but these figures show the desktop layout.
- The stage states quoted in section 2 are the states observed on the worked example after one run. Different inputs produce different states, which is the status system working rather than an error.
- The preserved before report could not be rasterised in the environment used to write this guide, because no PDF-to-image tool was available there. Its figures above are therefore quoted from its extracted text and its saved application snapshot rather than shown as an image.
- Stage 09, equipment selection, appears in the worked example as an empty state, so this guide does not include a figure of catalog matching in action. That step needs a case with engineer duty and head data supplied.