Requirements
- Decided
- Product flow, recovery target, product TDS target.
- Calculated
- Nothing yet — these are the stated targets the whole design is measured against.
- Output
- A requirement set the platform will not overwrite with derived values.
Save, organize and restore your calculations.
Keep sync and organize your saved records.
One complete seawater reverse osmosis design, followed from design basis and feedwater analysis through the treatment train, mass balance, engineering requirements, equipment, schedule, bill of quantities and the engineering report. Every figure below is produced by the same model the Plant Designer runs.
Synthetic demonstration / educational example — not project design. This is an illustrative case built to exercise the workflow. It is not a real plant, not a client project and not a procurement-ready design.
Open this case in Plant Designer View engineering report (PDF)
Seawater intake, media filtration and antiscalant dosing ahead of a single RO stage, with remineralisation and product storage after it. The high-pressure pump is drawn inline with the train, not as a process stage of its own — a distinction that matters when the diagram is read as a process flow.
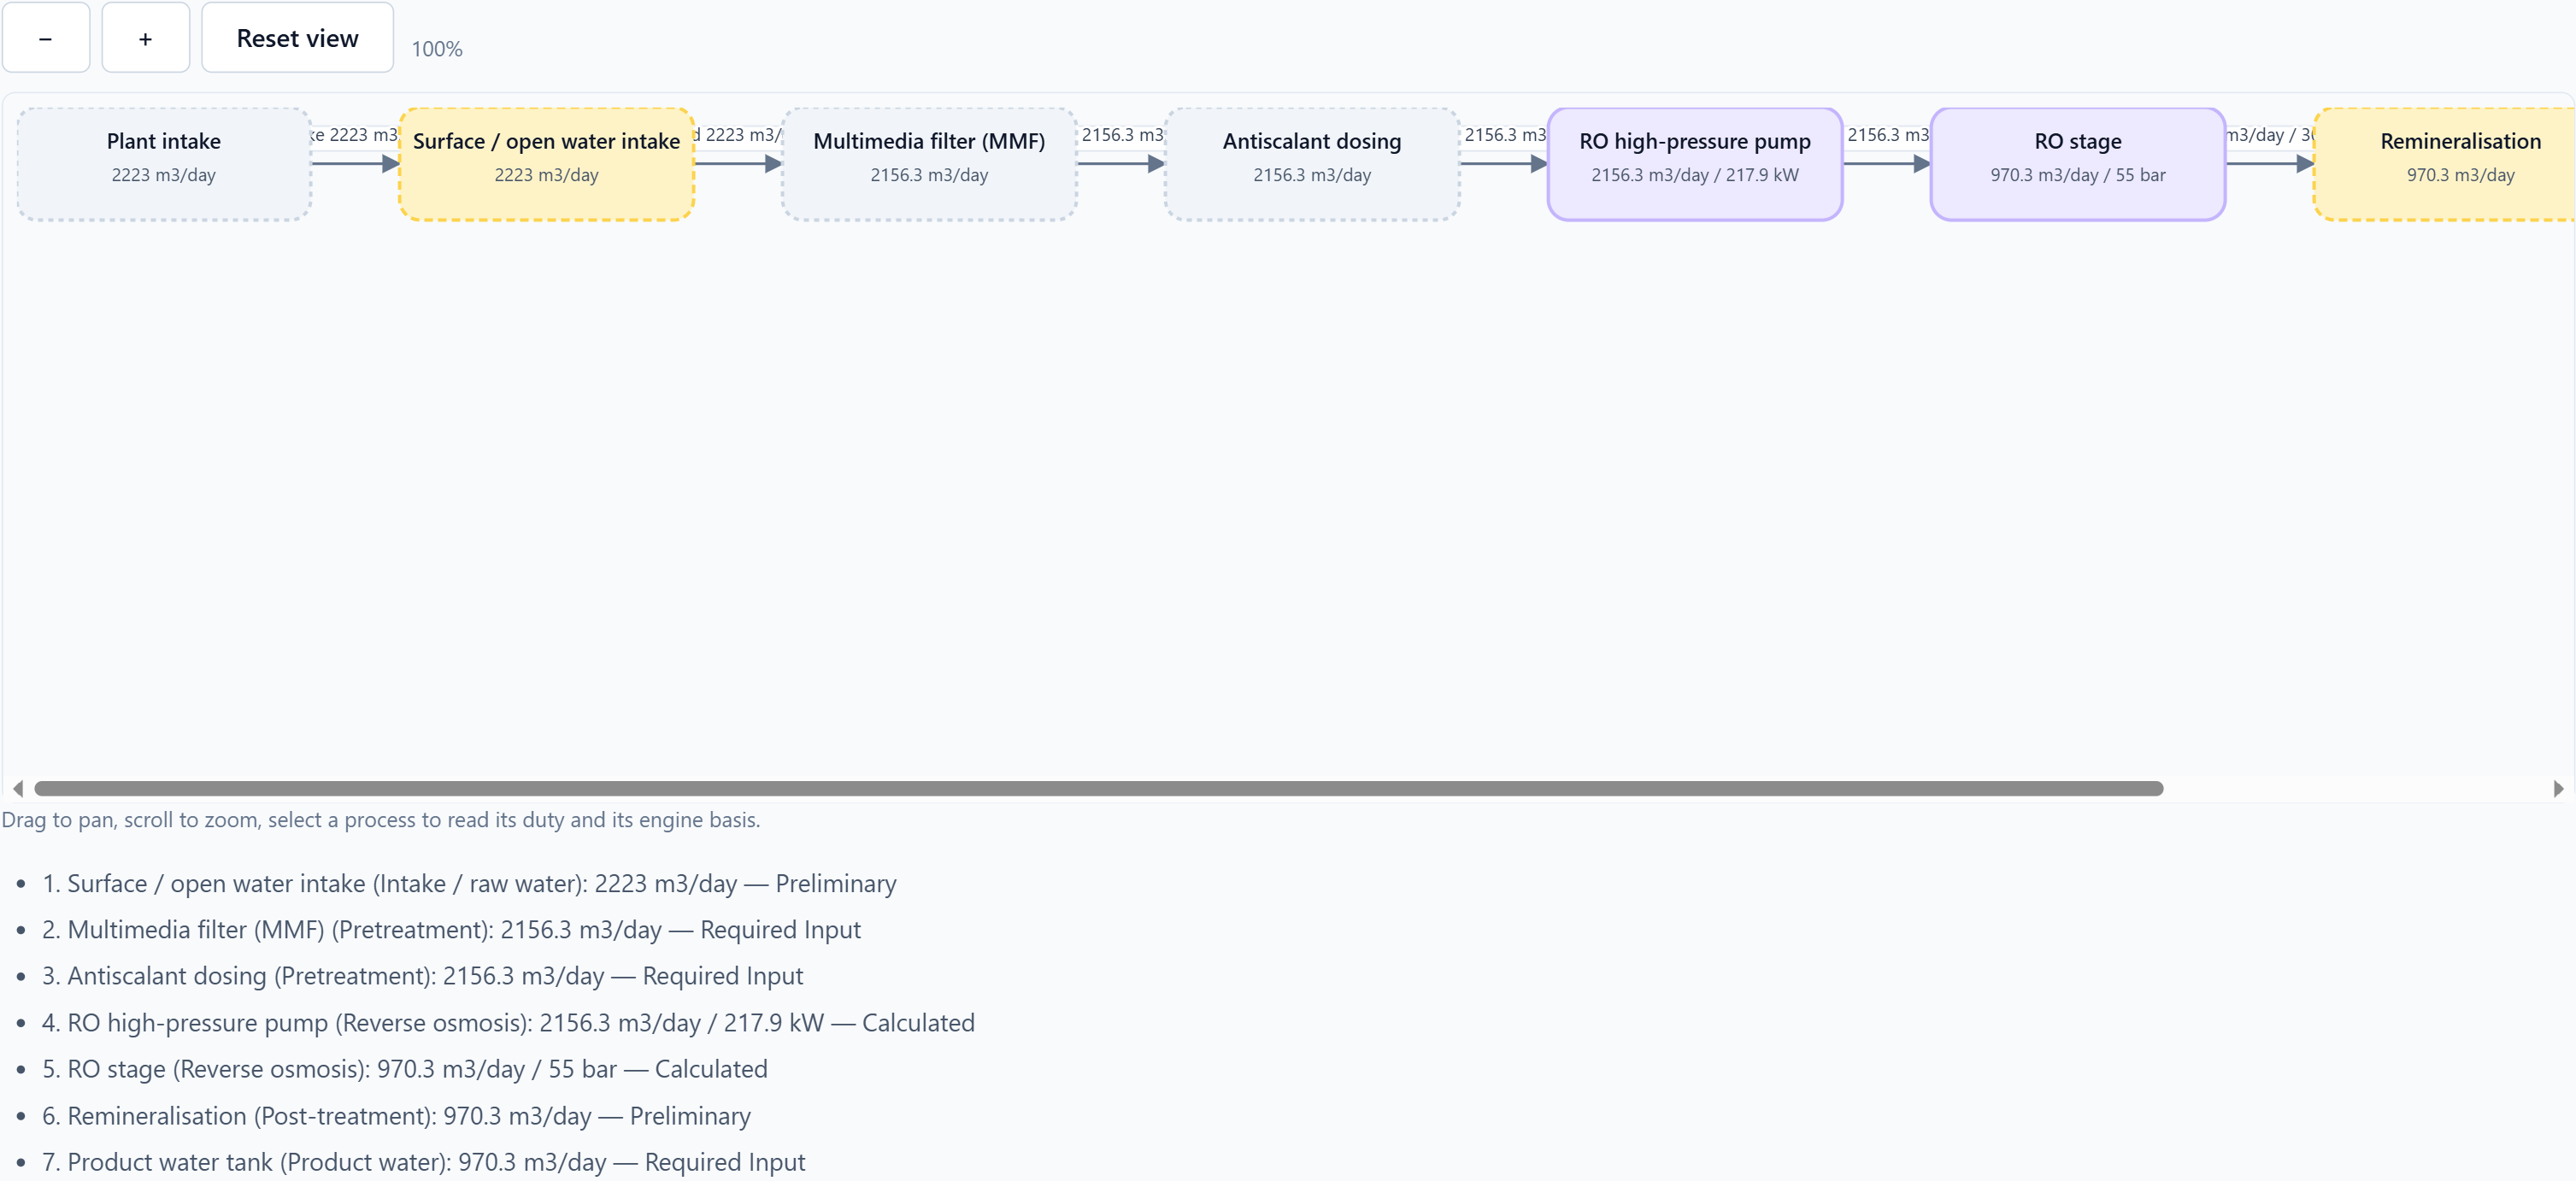
Intake flow and source type are stated inputs; they appear as the train origin.
Sized from stated design flow and the 97% filtrate recovery stated above.
Present in the train as a dosing step. Dose is an engineer/supplier input, not derived here.
Duty derived from RO feed and the stated 70% pump efficiency. Rendered inline with the train, not as a process level.
The mass balance, product quality and membrane duty all derive from this single stage.
Shown in the train; the re-mineralisation dose is an engineer decision, not derived.
Volume derives from product flow and a stated residence time.
A derived stream, not an input. Its quality follows from salt conservation.
Stated by the engineer. The platform does not substitute a derived figure for any of these, and a design is judged against them rather than against whatever the model happened to produce.
| Requirement | Target | Why it is a target, not a result |
|---|---|---|
| Required product flow | 1000 m³/day | The design target the plant must deliver. |
| Required recovery | 45% | Engineer decision. Sets the feed that must be abstracted. |
| Required product TDS | 300 mg/L | Product quality target. Distinct from the calculated result below. |
Feedwater analysis stays at engineer review even on a fully-run design. No software can confirm a laboratory analysis or a wellfield.
The membrane basis is an engineer or supplier input, chosen here so the case is internally consistent and runnable. It is not a catalogue entry and not a recommendation.
Feed is split into product and concentrate, and the concentrate quality follows from salt conservation rather than being specified. The balance closes because it is conservation — not because the numbers were fitted.
✓ 970.34 + 1185.97 = 2156.31 m³/day — closes against the RO feed
| Result | Calculated | Derived from |
|---|---|---|
| RO feed flow | 2156.31 m³/day | Intake × media-filter filtrate recovery |
| Product flow | 970.34 m³/day | RO feed × RO stage recovery |
| Concentrate flow | 1185.97 m³/day | RO feed − product |
| Plant recovery achieved | 45.0% | Product ÷ RO feed |
Product quality is derived from rejection and salt conservation. It is not a free input — which is why the calculated product TDS and the required product TDS target above are two different numbers, and why they should be compared rather than conflated.
The Designer’s own stages, in its own terminology. Note where a stage has nothing to calculate — that is the point of separating stated inputs from derived results.
Outputs are projections of the one engineering model, so they cannot disagree with each other. But they are also downstream of an engineer decision, and that decision has not been made in this example.
Equipment selection matches products against each requirement using the verified manufacturer catalog, and it is an engineer action. Until you perform it, the Designer reports Equipment, Schedule, BOQ and Report as not started, and the report says so rather than inventing an equipment list. The report PDF linked below was generated from a session in which that selection had been made — it is a real generated report, not a mock-up.
Twenty-one sections and seven tables, including the same plant-flow projection the Designer draws. Dates are formatted, not raw ISO.
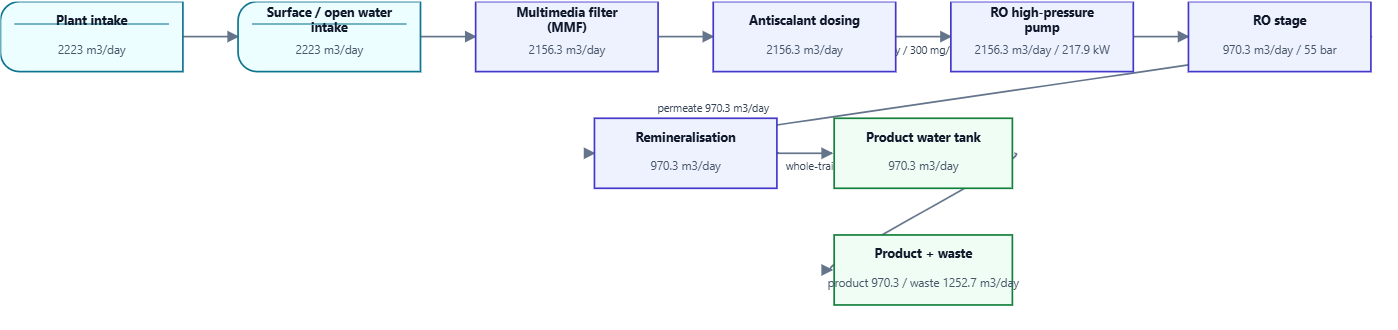
Open this case in the Designer and it arrives already filled in. Change the product flow, the recovery or the feedwater chemistry, run the design, and watch the balance, the requirements and the diagram move together — because they are all derived from one model rather than recalculated by hand each time.
The same calculations behind this case, as standalone tools, for when you want to test a figure with your own inputs.
Check the 45% recovery this example is built on, against a feed you actually have.
Confirm the concentrate volume a given recovery produces — the figure most often misused downstream.
Verify the product quality that the stated rejection produces in the permeate.
Derive product TDS from feed salinity and rejection rather than assuming it.
Price the specific power implied by the stated pressure, recovery and efficiency.